
Authors: Connor Jerzak | Anton Strezhnev | Gary King
If your goal is “What percent of documents are in each category?”, Readme2 is built for that job.
TL;DR: What Readme2 does
Readme2 estimates category proportions directly—without first classifying every document—so you get better population-level answers when language shifts over time or categories are hard to separate. It improves older “readme” by (1) optimizing continuous text features and (2) using a matching step adapted from causal inference to make the labeled set look more like the unlabeled set.
- Best for: trend tracking, public opinion/text monitoring, policy speech coding, social media category shares
- Not ideal for: situations with extreme “emerging discourse” or no overlap between labeled/unlabeled language
- Proof point: extensive evaluation across many datasets and designs shows consistent wins for Readme2 over alternatives
What is Readme2?
Readme2 is a nonparametric quantification method: it estimates the proportion of documents in each category (e.g., 12% “supports policy,” 32% “opposes policy,” etc.) without needing to assign a label to each individual document first. The paper’s core claim is that direct estimation can avoid bias from classification pipelines, and Readme2 improves direct estimation by adding optimized continuous features and a causal-inference-inspired matching step.
Key terms you’ll see (and what they mean)
- Quantification (a.k.a. prevalence estimation): estimating category shares in a population
- Classify-and-count: classify each document, then count labels to get shares
- Semantic change: meaning/usage of language differs between labeled and unlabeled sets
Quantification vs. classification: what’s the difference?
Classification predicts labels for individual documents. Quantification estimates population proportions. Social science often cares more about the population-level answers (the “how many / what percent” question) than about whether any single document is labeled perfectly.
| Goal | Typical question | What “good” looks like | Common failure mode |
|---|---|---|---|
| Classification | “Is this document category A or B?” | High per-document accuracy | Accuracy looks fine, but aggregate shares drift |
| Quantification | “What % of documents are in each category?” | Low error in estimated proportions | Language shifts (semantic change) break calibration |
Why “classify-and-count” can mislead (even when accuracy improves)
Classify-and-count can increase bias in the estimated proportions because a classifier optimized for individual accuracy can still make systematic errors that don’t cancel out. The paper gives an intuitive example: a rule like “war never occurs” can be >99% accurate for rare events but totally misleading for inference about war incidence.
- Accuracy ≠ unbiased proportions. You can label “well” per document and still estimate category shares poorly.
- Calibration assumptions break in the real world. Training and test distributions often differ over time (think: evolving topics, slang, new entities).
- Quantification methods should be optimized for quantification. Readme2 explicitly targets that goal.
How does the original Readme estimator work (in one equation)?
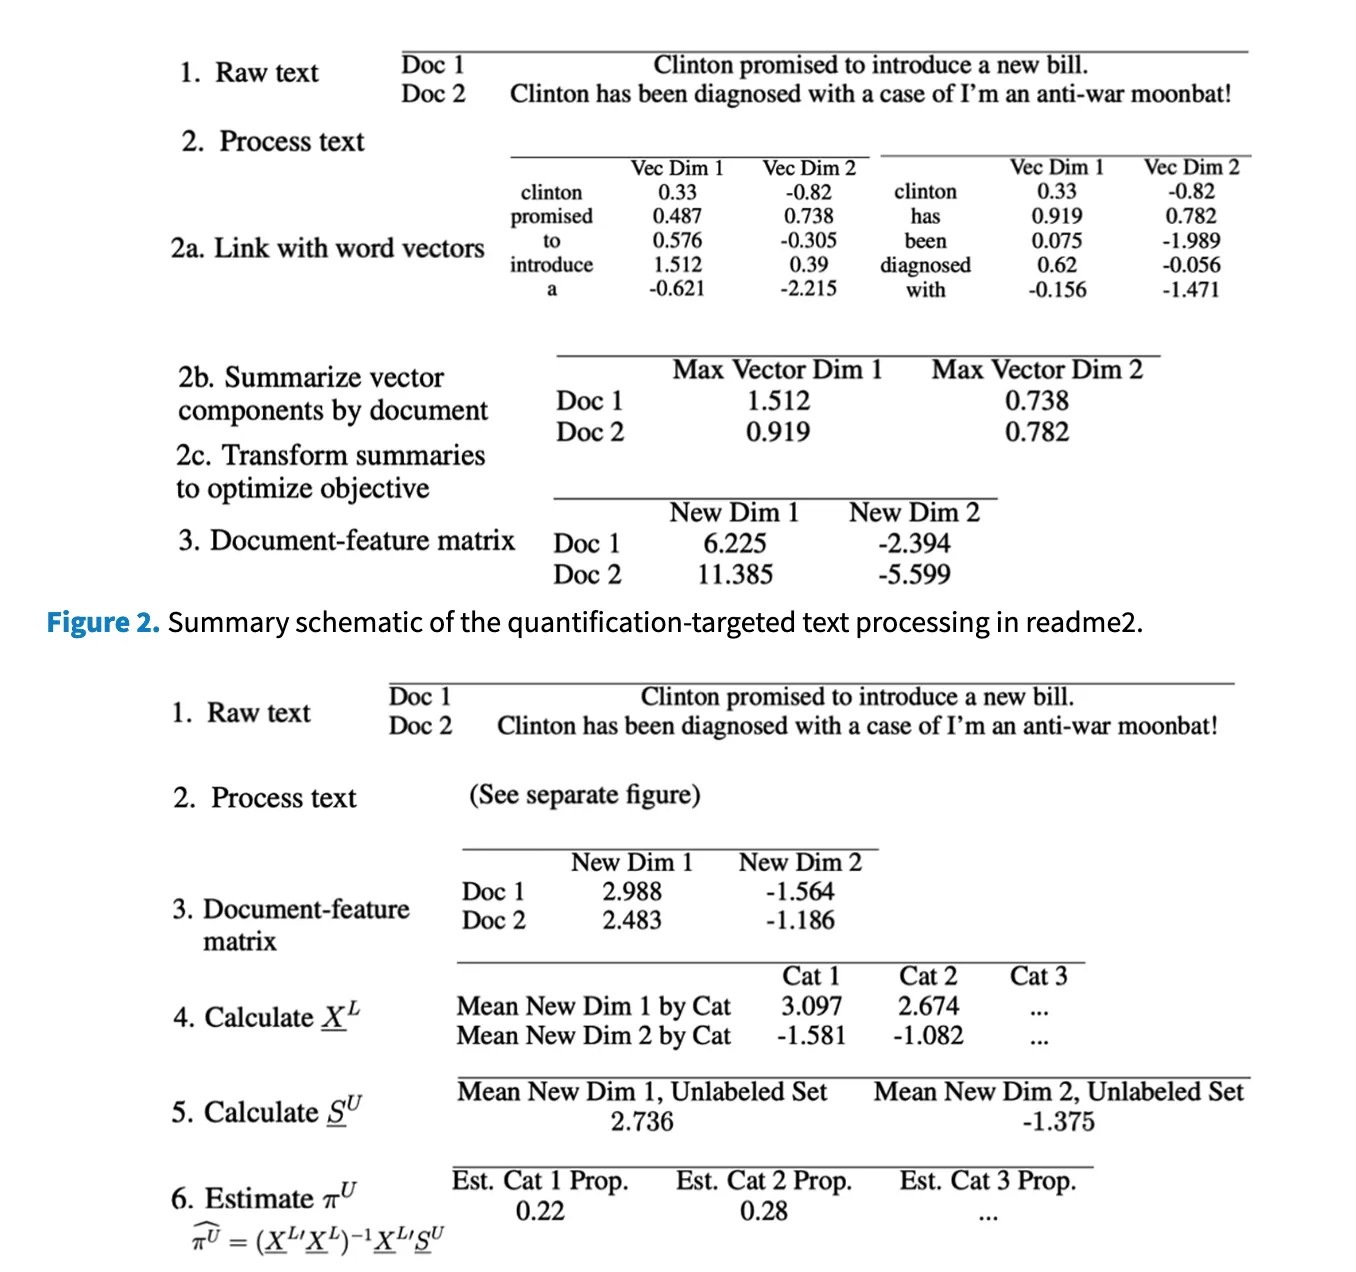
Readme converts text to features, then solves a linear accounting identity that links unlabeled feature frequencies to category proportions. In matrix form, the identity is:
S^{U} = X^{U}\pi^{U}Since X^{U} is unobserved, Readme estimates proportions using labeled-set estimates X^{L} and least squares:
\hat{\pi}^{U} = (X^{L\top}X^{L})^{-1}X^{L\top}S^{U}What assumption matters most?
Classic classification often assumes train/test are drawn from the same distribution. Readme relaxes this by focusing on the conditional feature patterns by category and (in a further relaxation) the conditional expectation being shared across labeled/unlabeled sets.
What breaks Readme in practice?
Three real-world issues show up repeatedly: (1) semantic change, (2) weak textual discrimination, and (3) proportion divergence between labeled and unlabeled sets.
1) Semantic change (concept drift)
Semantic change means language evolves across time or domains. The paper highlights two forms: emergent discourse (new words/meanings appear in the unlabeled set) and vanishing discourse (terms fade out).
2) Low textual discrimination
If categories don’t have differentiable language, any method struggles. The paper frames this as category distinctiveness and feature distinctiveness—practically, you need categories that are conceptually coherent and labels that are reliable.
3) Proportion divergence
If the labeled set’s category mix is very different from the unlabeled set’s mix, bias can grow. Readme2’s matching step is designed to reduce this divergence by pruning labeled documents that look unlike the unlabeled corpus.
How Readme2 improves: optimized continuous features + matching (a “text causal inference” move)
Readme2 makes two big changes: it (1) builds a continuous, quantification-tuned feature space and (2) matches the labeled set to the unlabeled set to reduce semantic mismatch and divergence—without peeking at unlabeled labels.
Improvement #1: Quantification-targeted dimension reduction
Instead of relying only on sparse word-stem profiles, Readme2 projects text into a lower-dimensional continuous space designed to separate categories with nonredundant signals. Conceptually, it transforms a document-feature matrix F into a new representation:
\bar{F} = F\GammaImprovement #2: Matching the labeled set to the unlabeled set
Matching prunes labeled documents that are “far” from the unlabeled documents in the transformed feature space, so estimation relies on parts of the labeled set that share overlap (“common support”) with the target corpus. Importantly, the matching is done without using category labels from the unlabeled set.
Readme2 vs. SVM vs. classic quantification methods: how well does it perform?
The authors evaluate Readme2 at unusually large scale—including many datasets and multiple evaluation designs—specifically to mimic realistic labeled-to-unlabeled shifts over time.
- 73 datasets: performance improved across a “diverse collection of 73 datasets”
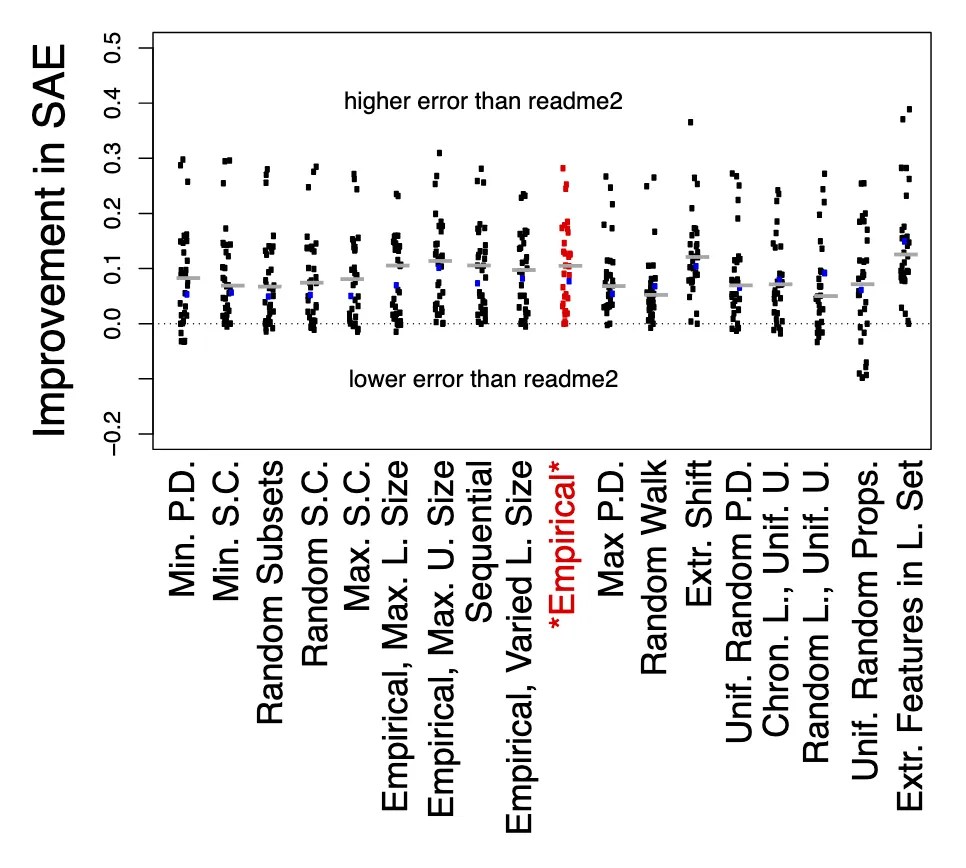
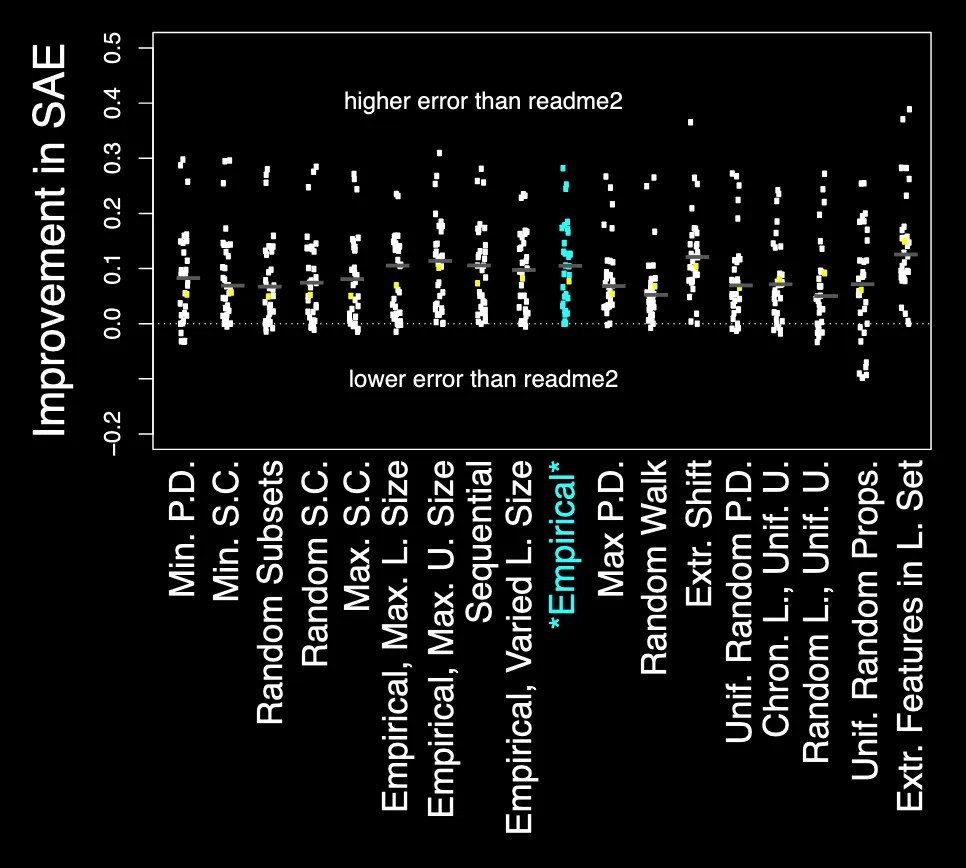
- 18 evaluation designs & 19,710 dataset evaluations: the study runs repeated out-of-sample testing across many labeled/unlabeled construction protocols
- Beats a strong classifier baseline: Readme2 outperforms the best classifier tested (SVM in continuous feature space) in 98.6% of corpora
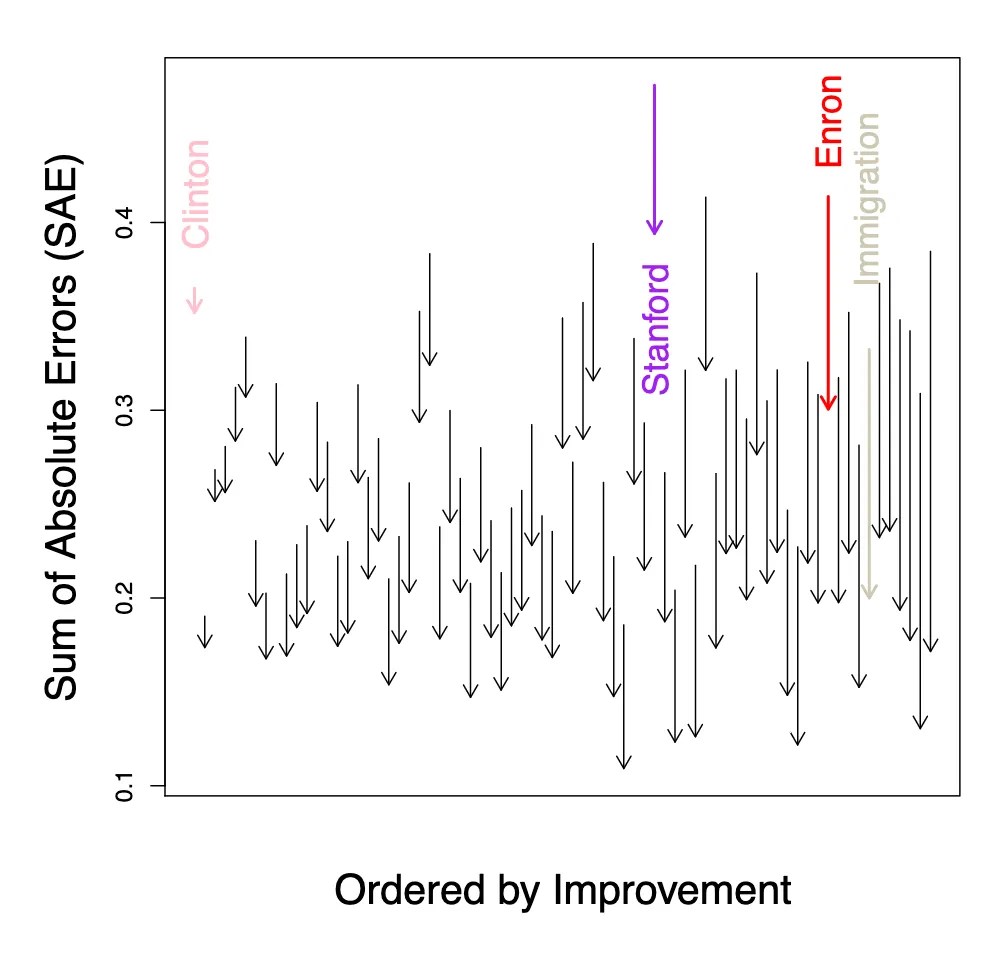
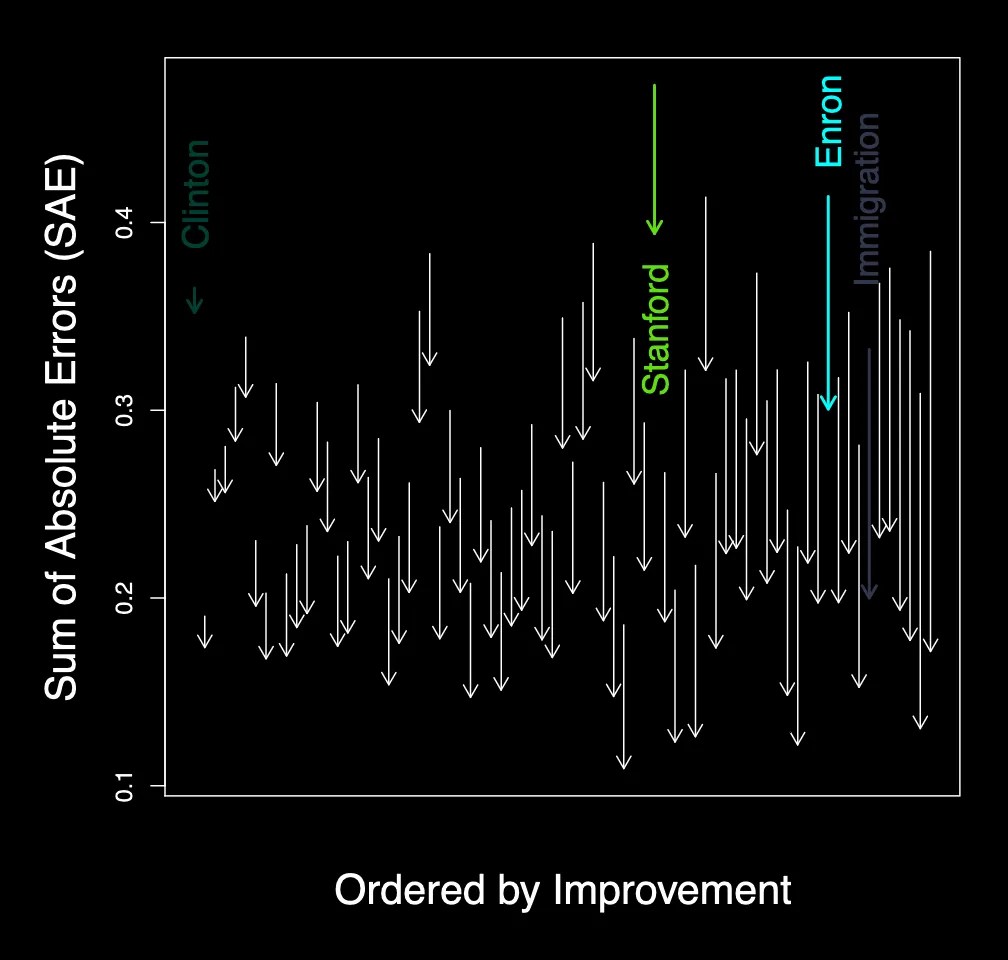
- Meaningful gains over Readme: in the “empirical” design, the paper reports a 34.3% average corpus-wide improvement over Readme, equivalent to an 8.6 percentage point SAE improvement
Why these results matter (especially for time series)
Most real quantification work labels once, then estimates repeatedly as new unlabeled text arrives. Readme2’s improvements are designed for exactly that: handling semantic change and distribution shift without requiring the training and test sets to be drawn from the same population.
How do you reproduce the paper (or apply it to your own corpus)?
Start with the official software and replication resources. The paper states that the open-source implementation is available in readme-software, and the replication materials are available via Harvard Dataverse.
- Get the code: github.com/iqss-research/readme-software
- Pick a dataset to learn on: for hands-on experimentation and benchmarking, explore TextQuantificationDatasets.
- Define categories carefully: ensure they’re mutually exclusive & exhaustive, and invest in reliable labeling.
- Split labeled vs. unlabeled realistically: if you expect time drift, split chronologically (label earlier, estimate later).
- Run quantification, then sanity-check: validate on a small held-out labeled slice when possible; inspect errors by category.
When should you NOT use Readme2 (or what should you watch out for)?
Readme2 is robust, but not magic. The paper flags cases where improvements may be limited and suggests practical fixes.
- Extreme emerging discourse / no overlap: if relevant discourse disappears entirely within a category, estimation can become risky (think “no common support”). A practical fix is to label additional documents closer in time to the target data.
- Highly uninformative text or messy labels: sparse/irrelevant feature spaces and error-ridden coding can make optimization unstable.
- Embedding mismatch: if the pretrained word vectors are from the “wrong world” (e.g., trained on Twitter but your corpus is legal contracts), performance can suffer—swap embeddings.
FAQ: Readme2 and text quantification
What is “quantification” in NLP?
Quantification is estimating how many documents belong to each category—i.e., category prevalence—rather than predicting each document’s label.
Why not just train a classifier and count predictions?
Because optimizing individual-level accuracy can still yield biased aggregate proportions—especially under distribution shift or when misclassification costs and calibration differ from your research goal.
How does Readme2 handle semantic change?
It uses a matching step in a continuous feature space to prune labeled documents that are far from the unlabeled corpus, reducing mismatch and proportion divergence without using unlabeled labels.
What text representation does Readme2 use?
In the paper’s implementation, it uses 200-dimensional GloVe vectors trained on a large Twitter corpus and summarizes each dimension via quantiles (10th/50th/90th) to create document-level features.
Is there open-source code available?
Yes—an easy-to-use open-source implementation is available in the readme-software repository, and replication materials are available via Harvard Dataverse.
–
References
@article{jerzak2023improved,
  title={An Improved Method of Automated Nonparametric Content Analysis for Social Science},
  author={Jerzak, Connor T. and Gary King and Anton Strezhnev},
  journal={Political Analysis},
  year={2023},
  volume={31},
  number={1},
  pages={42-58},
  publisher={}
}–
Related Work
@article{pieuchon2024can,
  title={Can Large Language Models (or Humans) Disentangle Text?},
  author={Pieuchon, Nicolas Audinet de and Adel Daoud and Connor T. Jerzak and Moa Johansson and Richard Johansson},
  journal={Proceedings of the Sixth Workshop on Natural Language Processing and Computational Social Science (NLP+ CSS 2024)},
  year={2024},
  pages={57--67},
  publisher={}
}@article{libgober2024linking,
title={Linking Datasets on Organizations Using Half-a-Billion Open-Collaborated Records},
author={Libgober, Brian and Connor T. Jerzak},
journal={Political Science Methods and Research},
year={2024},
pages={1-20},
publisher={}
}@article{daoud2022conceptualizing,
title={Conceptualizing Treatment Leakage in Text-based Causal Inference},
author={Daoud, Adel and Connor T. Jerzak and Richard Johansson},
journal={Proceedings of the Annual Conference of the North American Chapter of the Association for Computational Linguistics (NAACL)},
year={2022},
volume={},
pages={5638--5645},
publisher={Association for Computational Linguistics},
doi={10.18653/v1/2022.naacl-main.413}
}–