
Authors: John Gerring | Connor Jerzak | Erzen Öncel
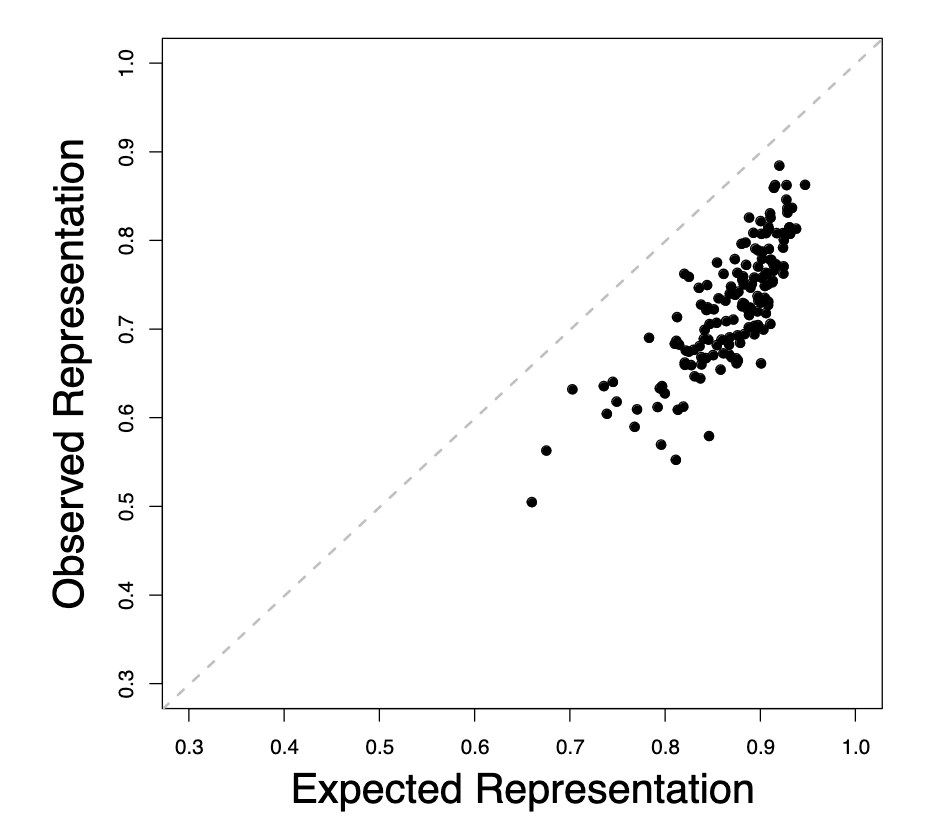
Takeaway: Across 156 countries, descriptive representation is consistently below the “random draw” baseline—and about half of the cross-country and cross-body variation is explained by compositional facts like how big the body is and how diverse the population is.
What is descriptive representation?
Descriptive representation is the idea that leaders “look like” the people they govern—meaning their identities (such as gender, ethnicity, religion, and language) mirror the population’s composition.
In the paper’s framing, descriptive representation is mainly a selection problem: once leaders are chosen, their identity is not something that can be easily “adjusted,” making proportionality hard to achieve in practice.
What did the authors do (and what did they find)?
They built a worldwide dataset of leaders and compared leaders’ identities to population shares—then showed that compositional factors (body size and diversity) explain roughly half of the observed variation in representation.
- They examine over 50,000 political leaders across 1,552 political bodies in 156 countries.
- They code major identity dimensions (including gender, ethnicity, language, religion) and test how proportional leadership is relative to the underlying population.
- They report a striking pattern: no country hits rough proportionality across social groups, and outcomes are below a random-draw benchmark.
How is descriptive representation measured (the index)?
The paper uses a proportionality-style index that compares each group’s population share to its share within a political body, then summarizes the overall mismatch.
Here’s the core formula (higher is better, from 0 to 1):
\displaystyle R_b = 1 - \frac{1}{2}\sum_{k=1}^{K}\left|g_{p_k}-G_{b_k}\right|Interpretation: If a body’s group shares match the population perfectly, the sum of absolute differences goes to 0 and R_b=1. Larger mismatches push the score toward 0.
Concrete example (3 equal-sized groups):
\displaystyle R_b = 1 - \frac{1}{2}\left(|0.33-0.50|+|0.33-0.25|+|0.33-0.25|\right)\approx 0.83What is the “compositional” or random-sampling model?
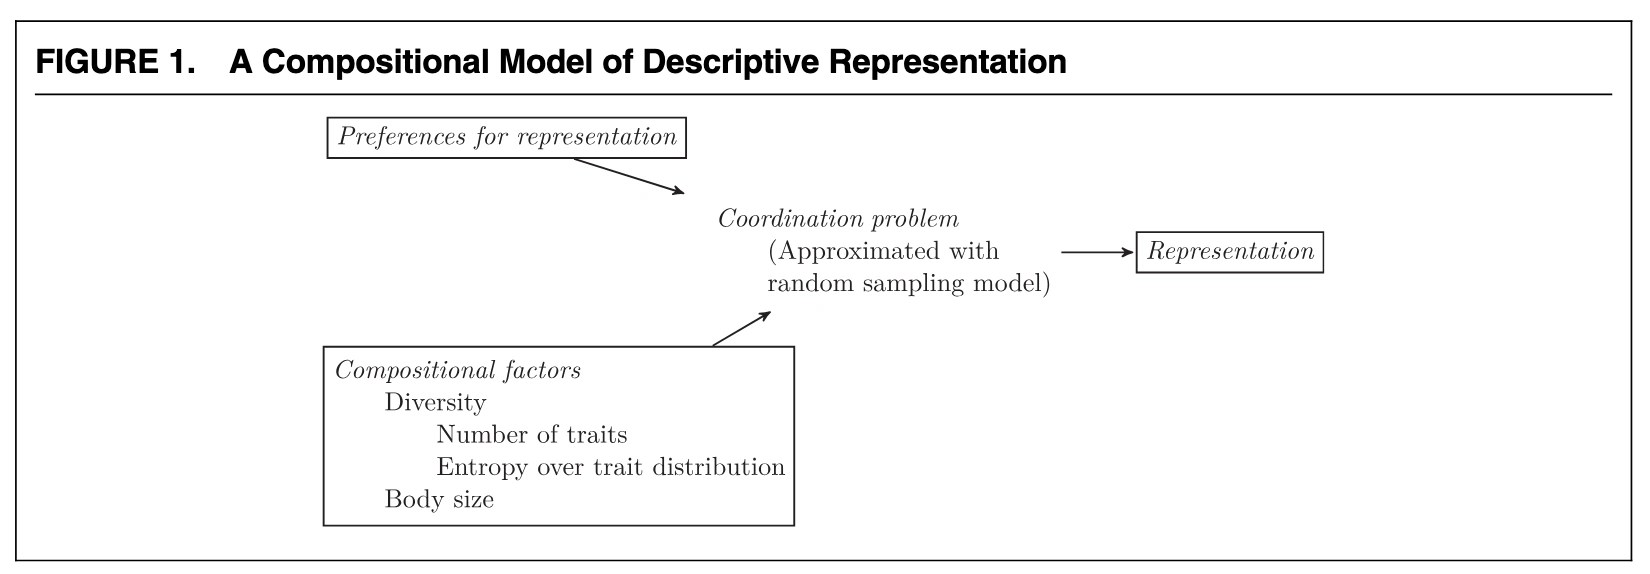
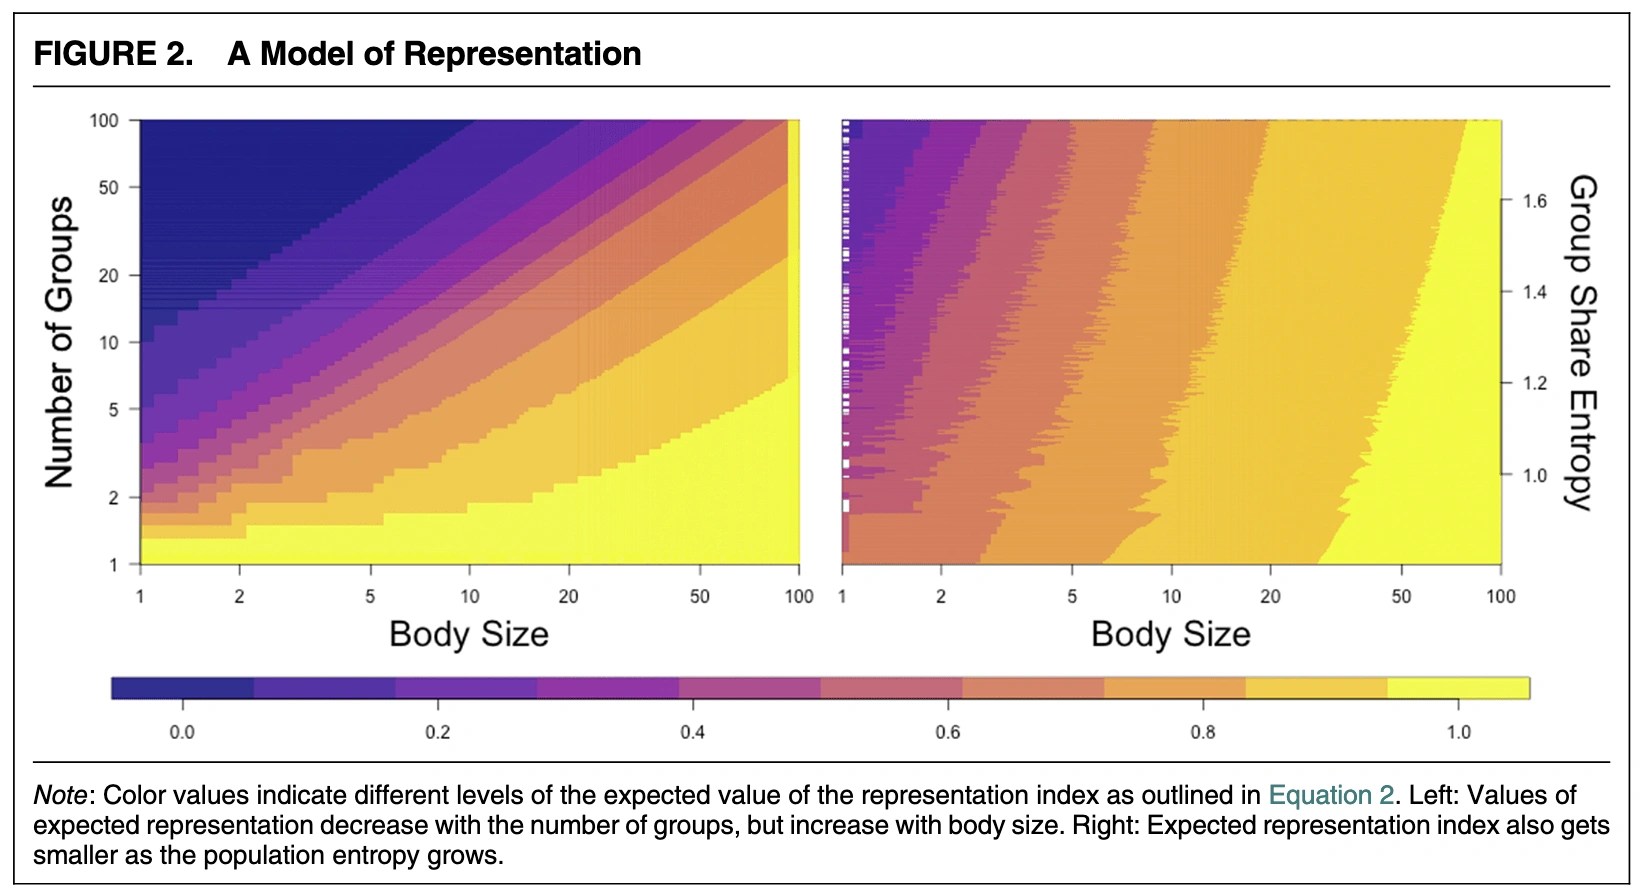
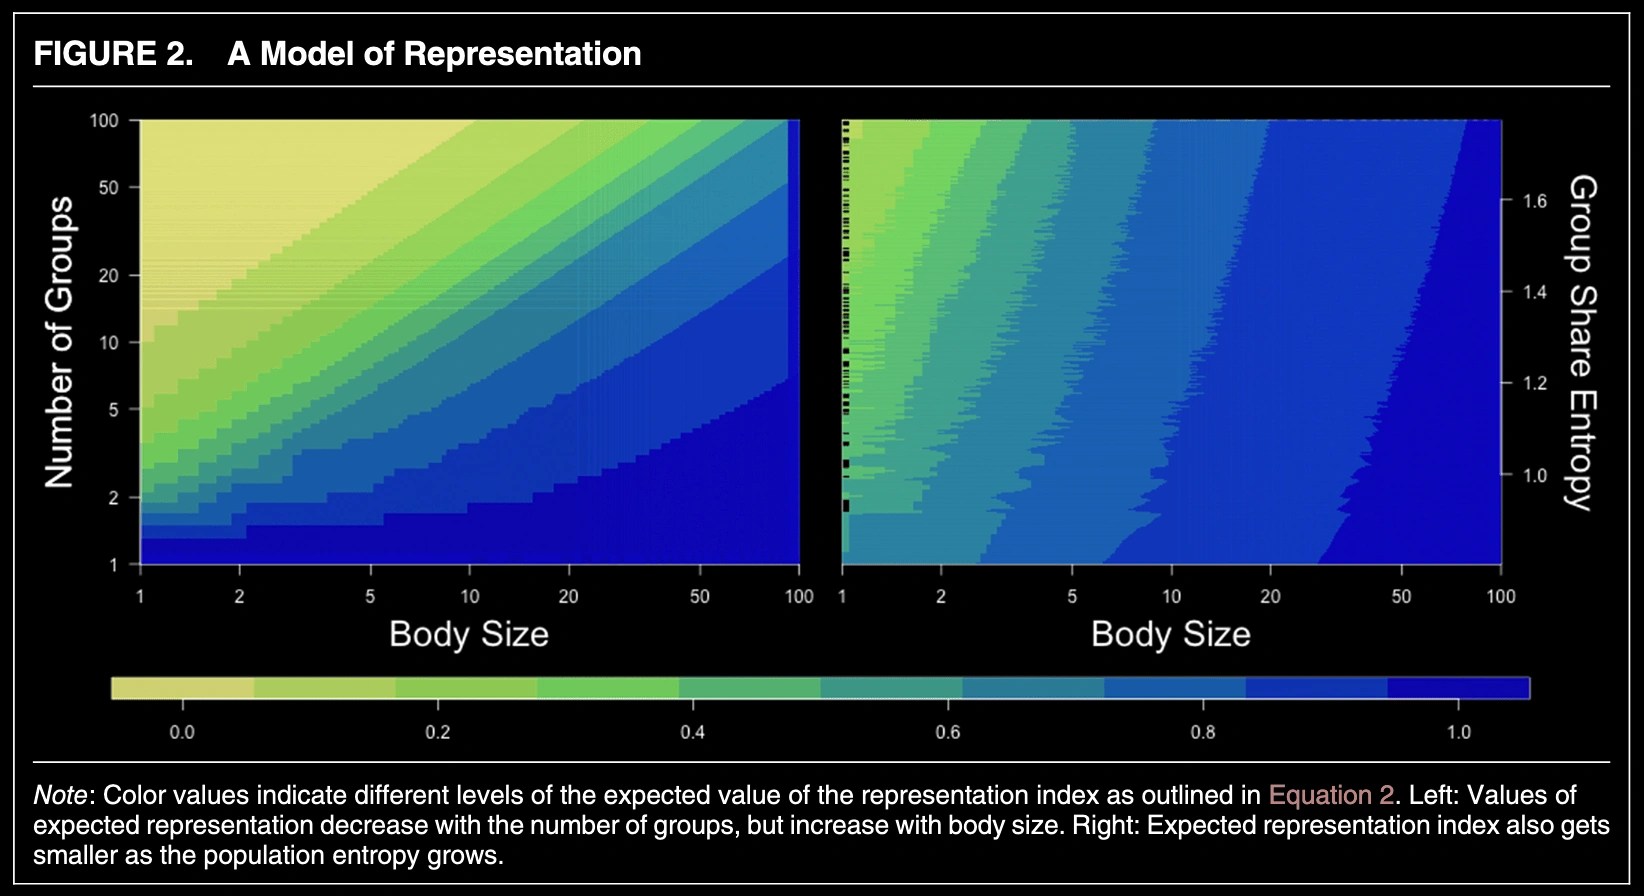
It’s a clean baseline that asks: “If leaders were selected like a random sample from the population, how representative would a body of size n_b typically be?”
This matters because it isolates the “math of the challenge” from everything else—electoral rules, party gatekeeping, discrimination, and so on. If the random-sampling baseline already predicts a lot, then coordination constraints from composition are doing real work.
The model highlights three compositional drivers:
- Body size: bigger bodies can “fit” more categories.
- Number of groups: more groups means more ways to miss proportionality.
- Entropy (how evenly sized groups are): equal-sized groups raise the coordination difficulty.
Entropy, here, is:
\displaystyle \mathrm{Entropy}(g_{p_1},...,g_{p_K}) = -\sum_{k=1}^{K} g_{p_k}\log(g_{p_k})What does the global evidence show?
Representation is systematically imperfect worldwide, and two variables—body size and fractionalization—do a remarkably good job explaining why some places and institutions do better than others.
1) The “nobody is proportional” result
Across this sample, the authors report that no country represents all social groups in rough proportion to their population shares, and that countries do not even reach the level expected under a pure random-draw benchmark.
2) The country-level distribution (useful for benchmarking)
Aggregating across identity dimensions, the paper reports an average country representation score of 0.73 (with minimum 0.50 and maximum 0.88), and highlights examples of high- and low-scoring countries.
3) Composition beats most “usual suspects”
In regression results, body size (log) is positively associated with representation and fractionalization is negatively associated—while many additional institutional and socioeconomic variables add comparatively little explanatory power.
4) You can “see” body size in the real world
The paper notes that average membership varies sharply by institution: executives are tiny (often 1–2 people), while legislatures are large—creating predictable differences in representational capacity even before you consider electoral rules.
5) These patterns generalize across identities and contexts
The same compositional logic shows up across identity dimensions (including an ethnicity+gender intersection) and across settings such as elected vs. unelected offices and democracies vs. non-democracies.
What are the practical implications (and tradeoffs)?
If you want more proportional descriptive representation, you often need (1) more seats, (2) fewer/vaguer categories, or (3) mechanisms that coordinate selection—but each comes with costs.
Compositional factors vs. institutional reforms: what’s the difference?
- Compositional constraints are the “physics” of the problem: small bodies and highly diverse populations make proportionality harder, even with good intentions.
- Institutional reforms (quotas, electoral rules, recruitment practices) can help—but the paper’s headline is that composition explains a large share of the variance by itself.
Policy levers the paper implicitly points to
- Increase body size (where feasible): more seats can create more room to align leadership with social categories.
- Be explicit about which identities are being represented: adding categories (especially intersectional ones) can increase the coordination burden.
- Use structured coordination tools (e.g., quotas or selection constraints) when political goals prioritize descriptive representation.
Tradeoff alert: Enlarging bodies and adding representational constraints can change how institutions govern—sometimes benefiting inclusion, sometimes creating new frictions (e.g., decision-making inefficiency or other representation tradeoffs).
How to replicate (or compute the index for your own case)
Use the authors’ open-source calculator to compute observed and expected representation indices, and use the replication dataset to reproduce global analyses.
- Get the code: DescriptiveRepresentationCalculator-software (GitHub)
- Get the data: GlobalLeadershipProject_v1 (Hugging Face)
- Start simple: compute the representation index for one body (e.g., a cabinet or legislature) on one identity dimension (e.g., gender), then expand.
- Best practice: keep your group definitions consistent across population data and leader coding (the index is only as good as the category alignment).
FAQ
What’s the fastest way to explain the paper to a non-specialist?
Descriptive representation is hard partly because it’s a “fitting problem”: small leadership teams can’t reliably mirror complex, multi-group societies in the right proportions—so representation systematically falls short.
What does the representation index actually measure?
It measures total proportional mismatch between group shares in the population and group shares in a political body, summarized into a single 0–1 score.
Why does body size matter so much?
With more seats, the space of possible group combinations expands—and the body can better approximate population proportions simply through arithmetic.
Why does “fractionalization” reduce descriptive representation?
More (and more evenly sized) groups create more simultaneous proportionality targets; the coordination burden rises, and average mismatch increases.
Does the paper claim institutions don’t matter?
No. The point is that compositional factors explain a surprisingly large share of variation, and many additional covariates appear to have comparatively marginal effects in the global models.
–
–
–
References
@article{gerring2024composition,
  title={The Composition of Descriptive Representation},
  author={Gerring, John and Connor T. Jerzak and Erzen Öncel},
  journal={American Political Science Review},
  year={2024},
  volume={118},
  number={2},
  pages={784-801}
}–
Related Work
@article{gerring2026electoral,
  title={Electoral Rules and Descriptive Representation: A Comprehensive View Across Multiple Identities},
  author={Gerring, John and Alan Hicken and Connor T. Jerzak and Robert Moser and Erzen Öncel},
  journal={Under contract with Cambridge University Press},
  year={2026},
  volume={},
  number={},
  pages={}
}–