
Authors: John Gerring | Alan Hicken | Connor Jerzak | Robert Moser | Erzen Öncel
Short answer: Proportional, multimember systems consistently boost women’s representation. For most ethnic minorities, the story is more complicated – and often, electoral rules matter less than where people live.
TL;DR – What did this research find?
This blog distills the paper “Where Minorities are the Majority: Electoral Rules and Ethnic Representation” by John Gerring, Allen Hicken, Connor T. Jerzak, Robert G. Moser, and Erzen Öncel.
- Core question: Do proportional systems with multimember districts (MMDs) really improve descriptive representation for minorities compared to single‑member districts (SMDs)?
- Key finding for women: Across 45 mixed‑system elections in 15 countries, women are substantially more likely to enter parliament via the proportional MMD tier than via SMDs.
- Key finding for ethnic groups: For most ethnic minorities, electoral rules (SMD vs MMD) barely change how well they are represented – geographic concentration vs dispersion matters more.
- Mechanism: Parties chase votes. Voters exhibit affinity voting (they like candidates who share their group identity). If a group is large and geographically concentrated, it can win SMDs just fine.
- Boundary condition: MMDs help dispersed groups that form a big minority – often women, and a few widely spread ethnic or religious groups.
- Evidence stack: Formal derivations → simulations → a new global dataset on mixed systems → robustness tests → deep dives into elections in Russia and New Zealand.
If you want to understand when “PR is better for minorities” is true – and when it isn’t – this is what the paper pins down.
What problem does this paper solve?
The conventional wisdom in political science is simple: proportional representation is better for minorities. Because multimember districts allocate seats more proportionally, we often assume they automatically yield more women and more ethnic minority MPs.
This paper challenges that “always better” narrative. It asks a sharper question: under what conditions do multimember districts truly improve descriptive representation for different kinds of social groups – particularly women vs ethnic minorities?
Why isn’t “PR is better for minorities” the whole story?
It’s tempting to imagine that once you switch from SMDs to PR, every historically under‑represented group gets a boost. But that is only sometimes correct.
The paper shows that two features of a group fundamentally shape how electoral rules affect it:
- Group size – what share of the population (or electorate) belongs to the group?
- Geographic dispersion – is the group spread across the country, or clustered in specific regions or districts?
PR with multimember districts is not a magic bullet. In many contexts, especially for geographically concentrated ethnic minorities, SMDs and MMDs produce very similar levels of descriptive representation.
What do “group size,” “dispersion,” and “voting blocs” actually mean?
To understand the results, you need a few core concepts the authors use throughout the paper.
What is descriptive representation?
Descriptive representation asks: “Do the people in parliament look like the people in the country?” It’s about the share of seats held by a group (e.g., women, Māori, Kurds) relative to that group’s share of the population.
How are gender and ethnicity defined here?
Gender is treated in the traditional binary way (women vs men) because that’s how most of the studied elections and data are structured. The authors acknowledge the broader reality of non‑binary identities, but the data are binary.
Ethnicity is defined country‑by‑country as the most politically salient ascriptive cleavage. It may be based on language, religion, region, race, or national origin, depending on context.
What is a “voting bloc” and why is it different from population share?
Not everyone in a social group always votes for co‑ethnic or co‑gender candidates. So the authors distinguish:
- Demographic share: percentage of the population belonging to a group.
- Voting bloc share: percentage of voters who, all else equal, prefer candidates from their own group.
Women, for example, are a demographic majority in most countries, but as a voting bloc they behave like a large minority: many women still vote for male candidates.
How is “representation” measured in the model?
The paper uses a representation index that captures how closely the legislature matches the population. A simplified version looks like this:
R^{I} \;=\; 1 \;-\; \frac{1}{2}\sum_{k=1}^{K} \lvert g_k - G^{I}_k \rvertHere, g_k is group k’s share of the population, G^{I}_k is group k’s share of seats under institution I (SMD or MMD), and R^I ranges from 0 (no match) to 1 (perfect descriptive representation).
How does the formal model of electoral rules and representation work?
The authors build a stylized model of a country divided into districts. Each district has a mix of social groups; the composition follows a Dirichlet distribution, which lets them control how concentrated or dispersed those groups are.
They then compare two electoral rules:
- SMD (single‑member districts): one seat per district, winner‑take‑all.
- MMD (multimember districts) with PR: many seats allocated proportionally to parties, which are tied to social groups in the model.
What happens without affinity voting?
If you imagine elites being drawn “at random” from the population, SMD and MMD both converge to perfect representation in the limit of many districts. In that idealized world, electoral rules don’t matter much for descriptive representation.
What changes once you include affinity voting?
Once you allow voters to prefer co‑descriptive candidates (affinity voting) and let the largest group in each SMD win the seat, things change:
- SMDs over‑reward locally dominant groups.
- MMDs allocate seats closer to national vote and population shares.
- The mismatch between population and seats under SMD depends on how often each group is locally largest.
In the large‑district limit, the model shows that mis‑representation under SMD is driven by the gap between:
- how often a group is numerically largest in districts, and
- its overall share of the population.
That gap gets bigger when groups are more geographically dispersed and are neither tiny nor overwhelming majorities.
What do the simulations reveal about SMD vs MMD?
Because exact analytical expressions get messy, the paper runs simulations that mirror the formal setup but explore a wider range of scenarios and parameter values.
They systematically vary:
- Group size: from very small minorities to large majorities.
- Concentration vs dispersion: from tightly clustered in a few districts to evenly spread across all districts.
- Seat allocation rules: highest averages, largest remainder, and other common PR formulas.
- Degree of affinity voting: from weak to very strong preference for co‑descriptive candidates.
SMD vs MMD: which system is better for minorities?
The simulations show a clear “map” of when MMDs beat SMDs and when they don’t:
- If a group is very small: it struggles in both systems. There simply aren’t enough voters.
- If a group is a large majority everywhere: it dominates both SMDs and MMDs; rules make little difference.
- If a group is large and geographically concentrated: it can win SMDs in its stronghold districts, so SMD vs MMD doesn’t change much.
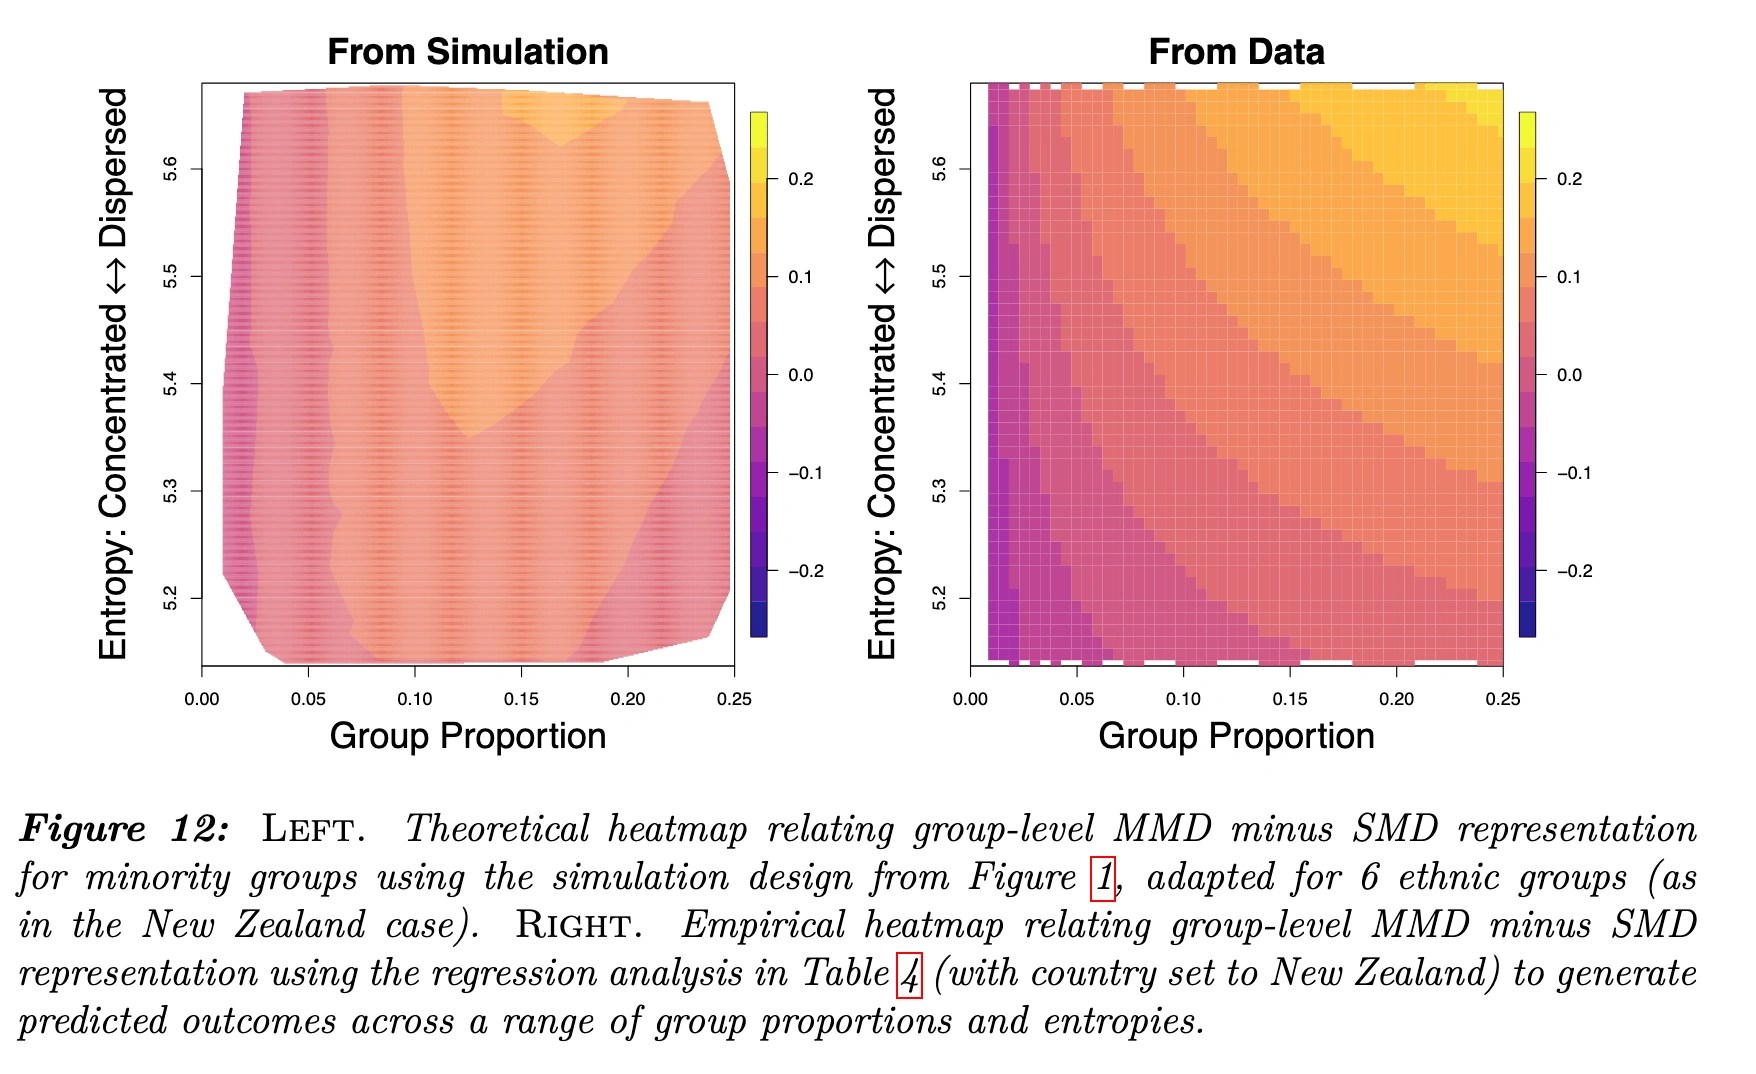
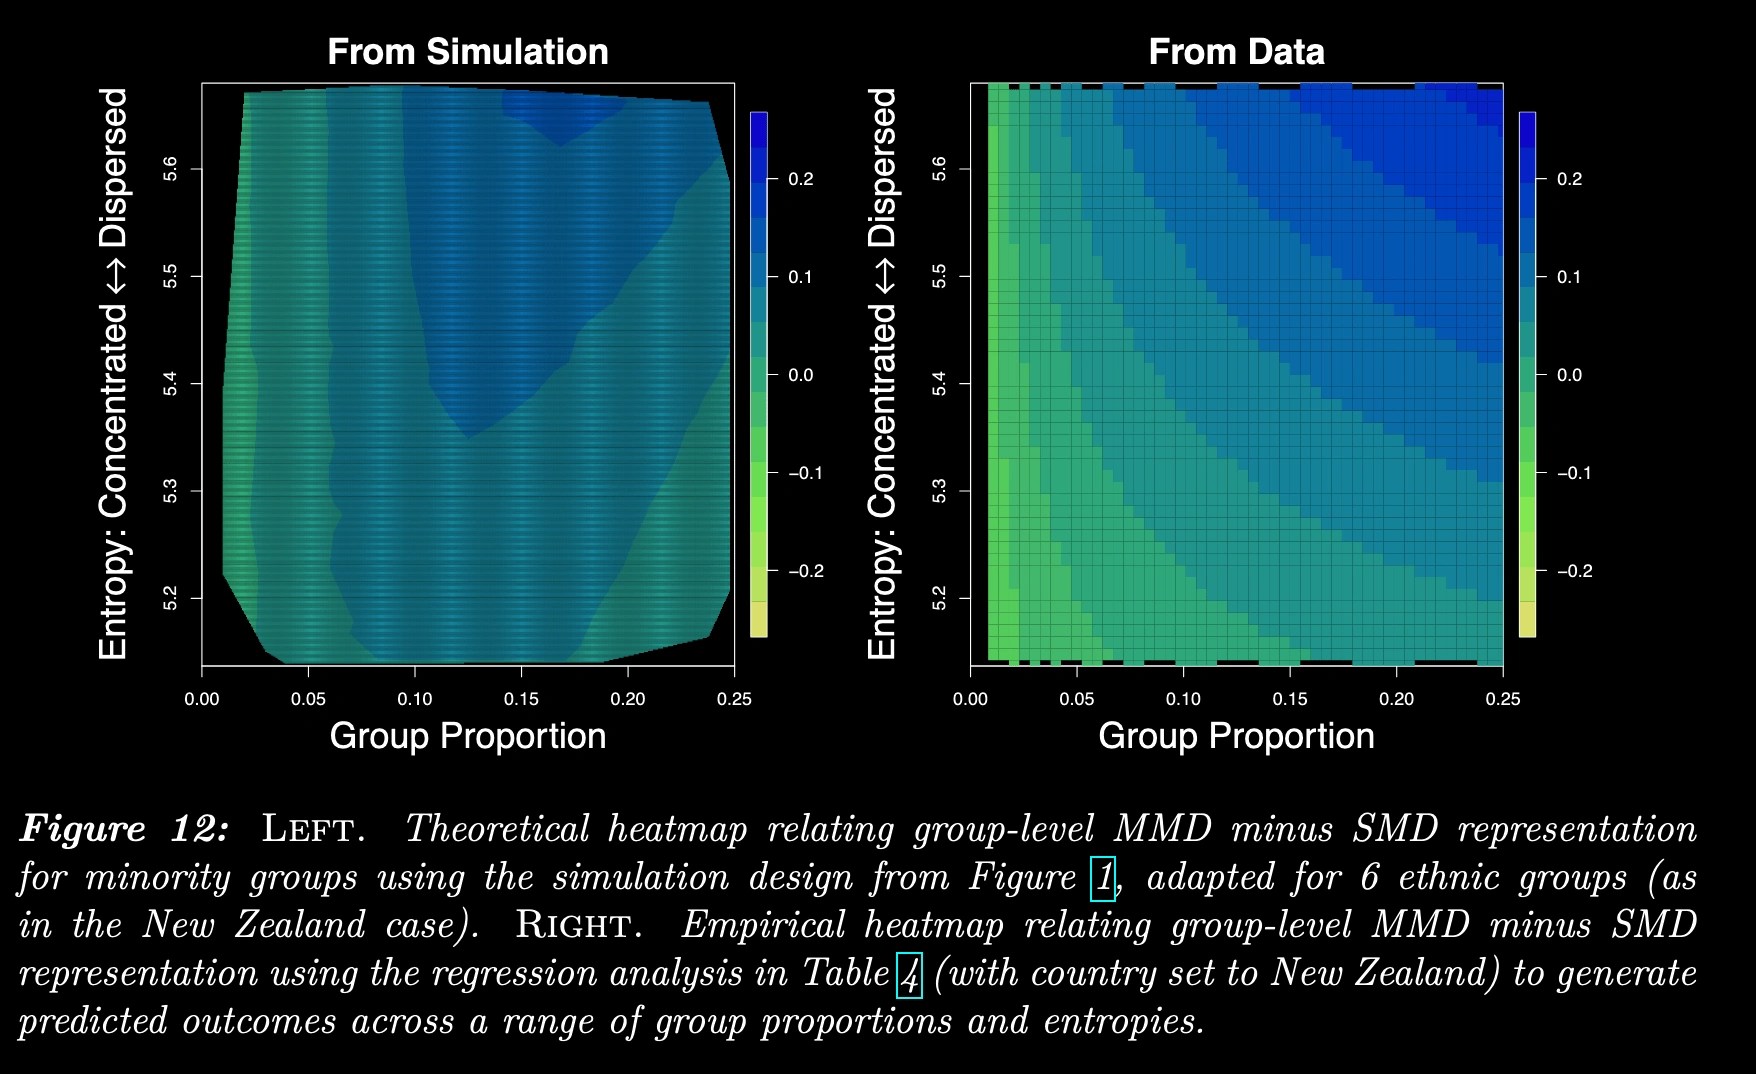
- If a group is a large, dispersed minority (around 30–45% nationally): MMDs create a big advantage, often 20–40 percentage points more seats than under SMD.
Overall representation across all groups is always at least as good in MMDs as in SMDs – but the size of that advantage depends heavily on group size and geographic dispersion.
What real‑world data did the authors collect?
To move from stylized models to real politics, the paper assembles a new global dataset focused on mixed electoral systems – systems that combine SMDs and PR‑based MMDs in the same election.
The dataset includes:
- 15 countries across multiple regions (e.g., Bolivia, Germany, Hungary, Japan, Lithuania, Mexico, New Zealand, Russia, South Korea, Taiwan, Thailand, Ukraine, and others).
- 45 national elections with simultaneous SMD and MMD tiers.
- Over 16,000 individual MPs with coded gender, ethnicity, party, and whether they entered via SMD or MMD.
- Information on district magnitudes, reserved seats (excluded from analysis), thresholds, and gender quotas.
Because SMD and MMD seats are filled in the same election, under the same party system, this setup acts like a within‑country comparison: we can see how the same groups fare under different electoral rules, holding country‑level factors constant.
So… do multimember districts help women?
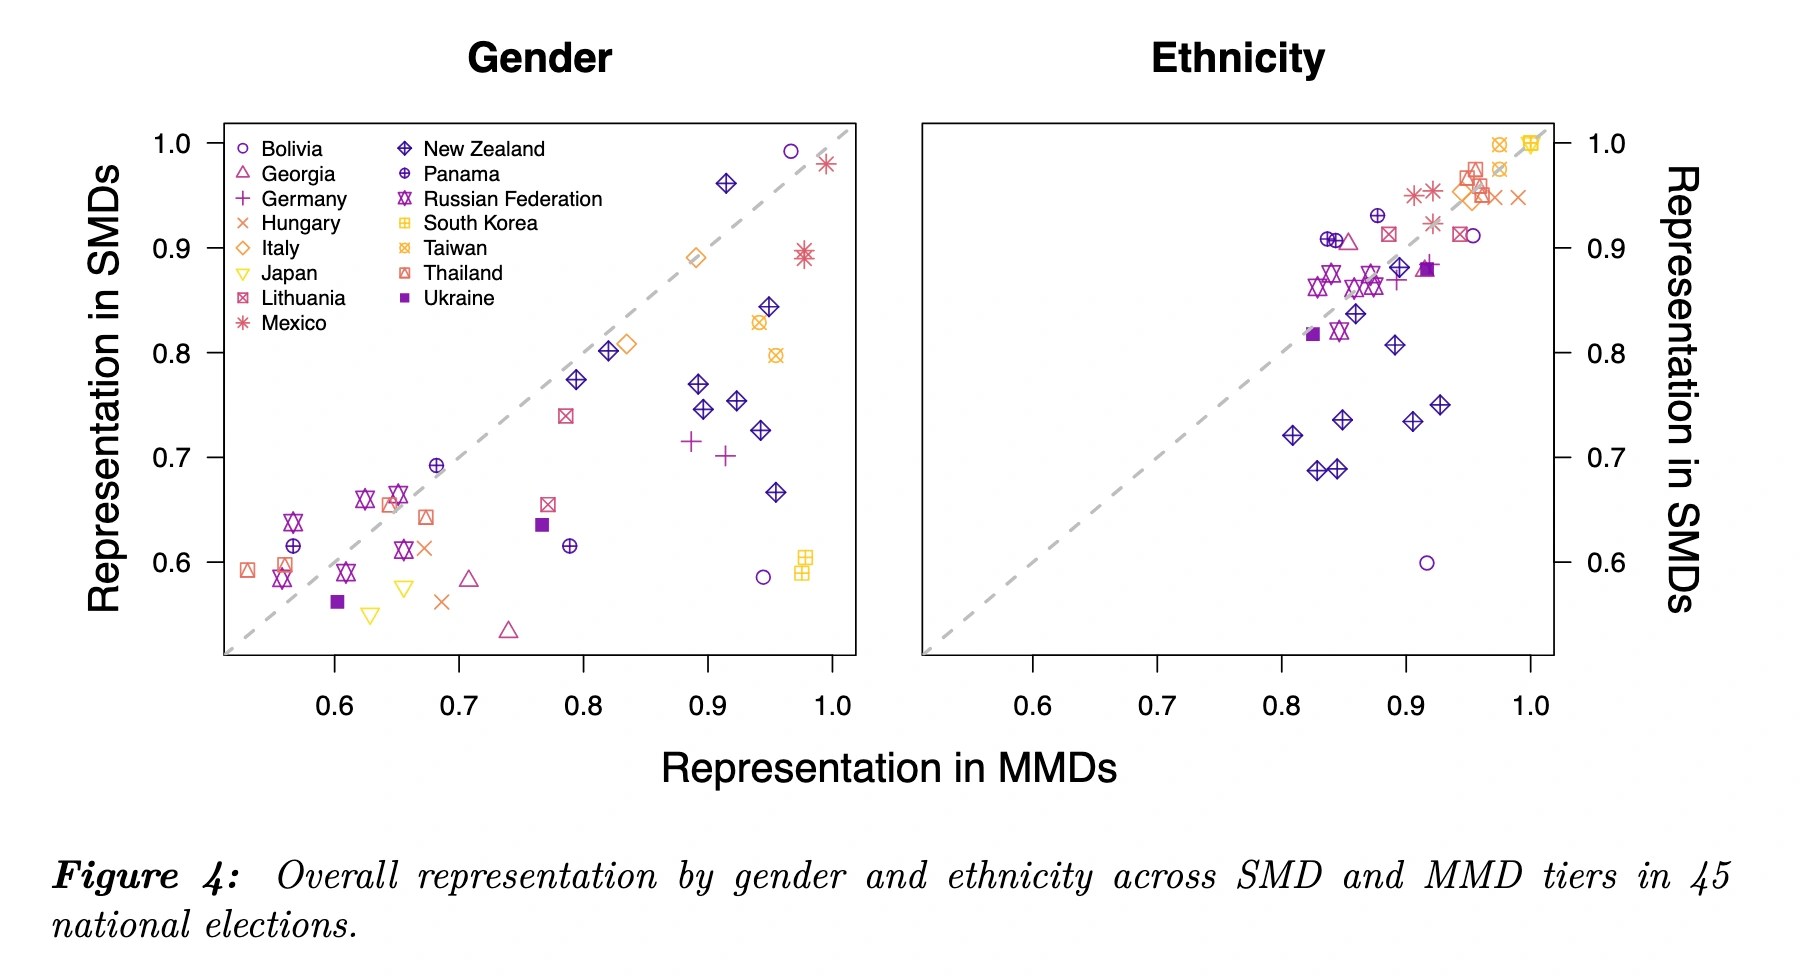
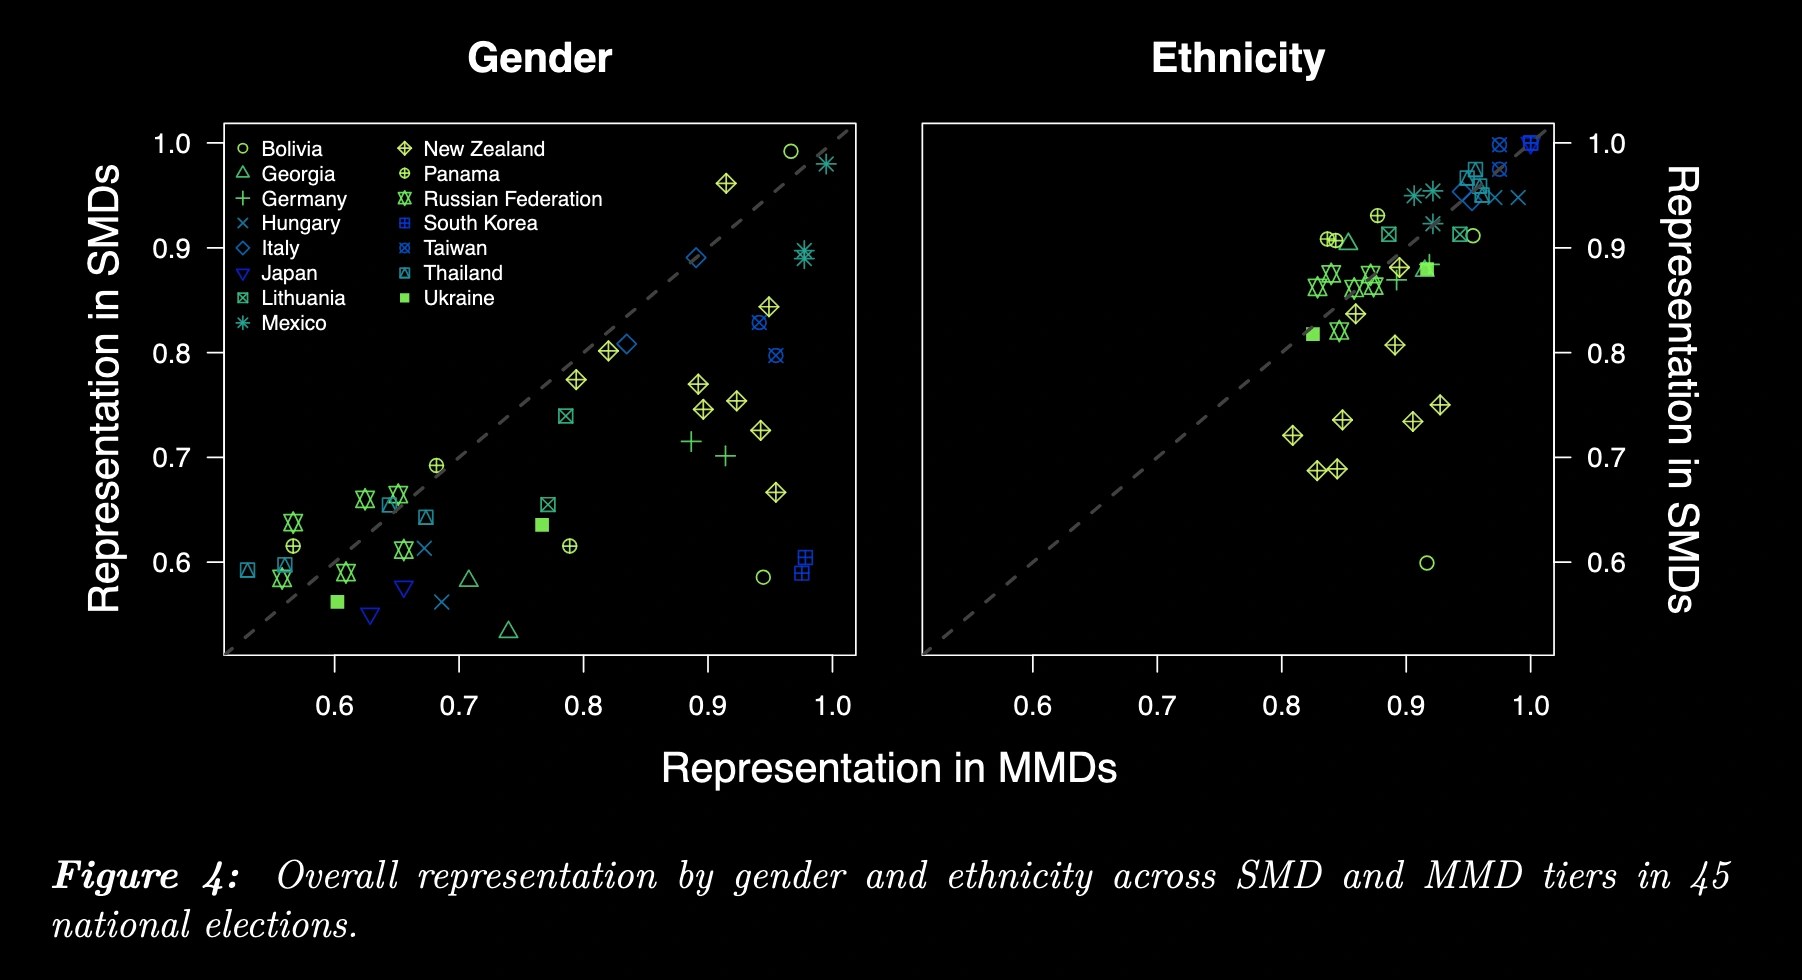
Yes. Across the mixed‑system dataset, women are consistently more likely to be elected via the proportional MMD tier than via SMDs.
Key empirical patterns:
- Female MPs have a significantly higher probability of coming from the MMD list tier rather than the SMD tier.
- At the aggregate level, the representation index for gender is almost always higher in MMDs than in SMDs – often by a large margin.
- These results hold across multiple model specifications, even after adding controls like time trends and country fixed effects.
Why? Because women are a large, geographically dispersed group. They rarely form local majorities as a cohesive voting bloc in specific districts, but they do form a large portion of the national electorate. MMDs allow parties to design balanced lists without risking winner‑take‑all losses in individual districts.
Do multimember districts help ethnic minorities?
Much less so. For ethnic groups, the effects of electoral rules are far weaker and often negligible. In many countries, ethnic minorities fare roughly the same under SMDs and MMDs.
Main findings:
- At the country level, the representation index for ethnicity is often similar in SMD and MMD tiers.
- Regression models that predict whether an MP enters via SMD or MMD based on their ethnic status show
strong, consistent patterns once you control for country. - Even when looking at non‑plurality groups (non‑dominant ethnic groups), the tier difference is weak.
The explanation ties back to geography: many ethnic minorities are regionally concentrated. They form local majorities or big pluralities in specific areas, which lets them win SMDs in their strongholds. In those cases, simply switching to PR with MMDs does not create much additional descriptive representation.
What about pure majoritarian vs pure proportional systems?
Mixed systems are useful for comparison, but many countries use only SMD (majoritarian) or only MMD PR systems. The authors therefore also examine a broader cross‑section of 251 elections in 115 countries that use one system or the other.
The pattern largely echoes the mixed‑system results:
- PR systems with MMDs tend to have better descriptive representation for women.
- For ethnic representation, the impact of moving from SMD to MMD remains weak and unstable across specifications.
This cross‑sectional evidence is noisier and more vulnerable to confounders, but it supports the central message: PR helps women more consistently than it helps ethnic minorities.
What do the Russia and New Zealand case studies show?
To see the mechanics more clearly, the paper zooms in on two very different elections:
- Russia, 1999 – a large, diverse federation with many ethnic groups, some regionally concentrated.
- New Zealand, 2014 – a stable democracy using mixed‑member proportional (MMP), with Europeans, Māori, Pacific Peoples, and Asian communities.
Russia 1999: many concentrated minorities
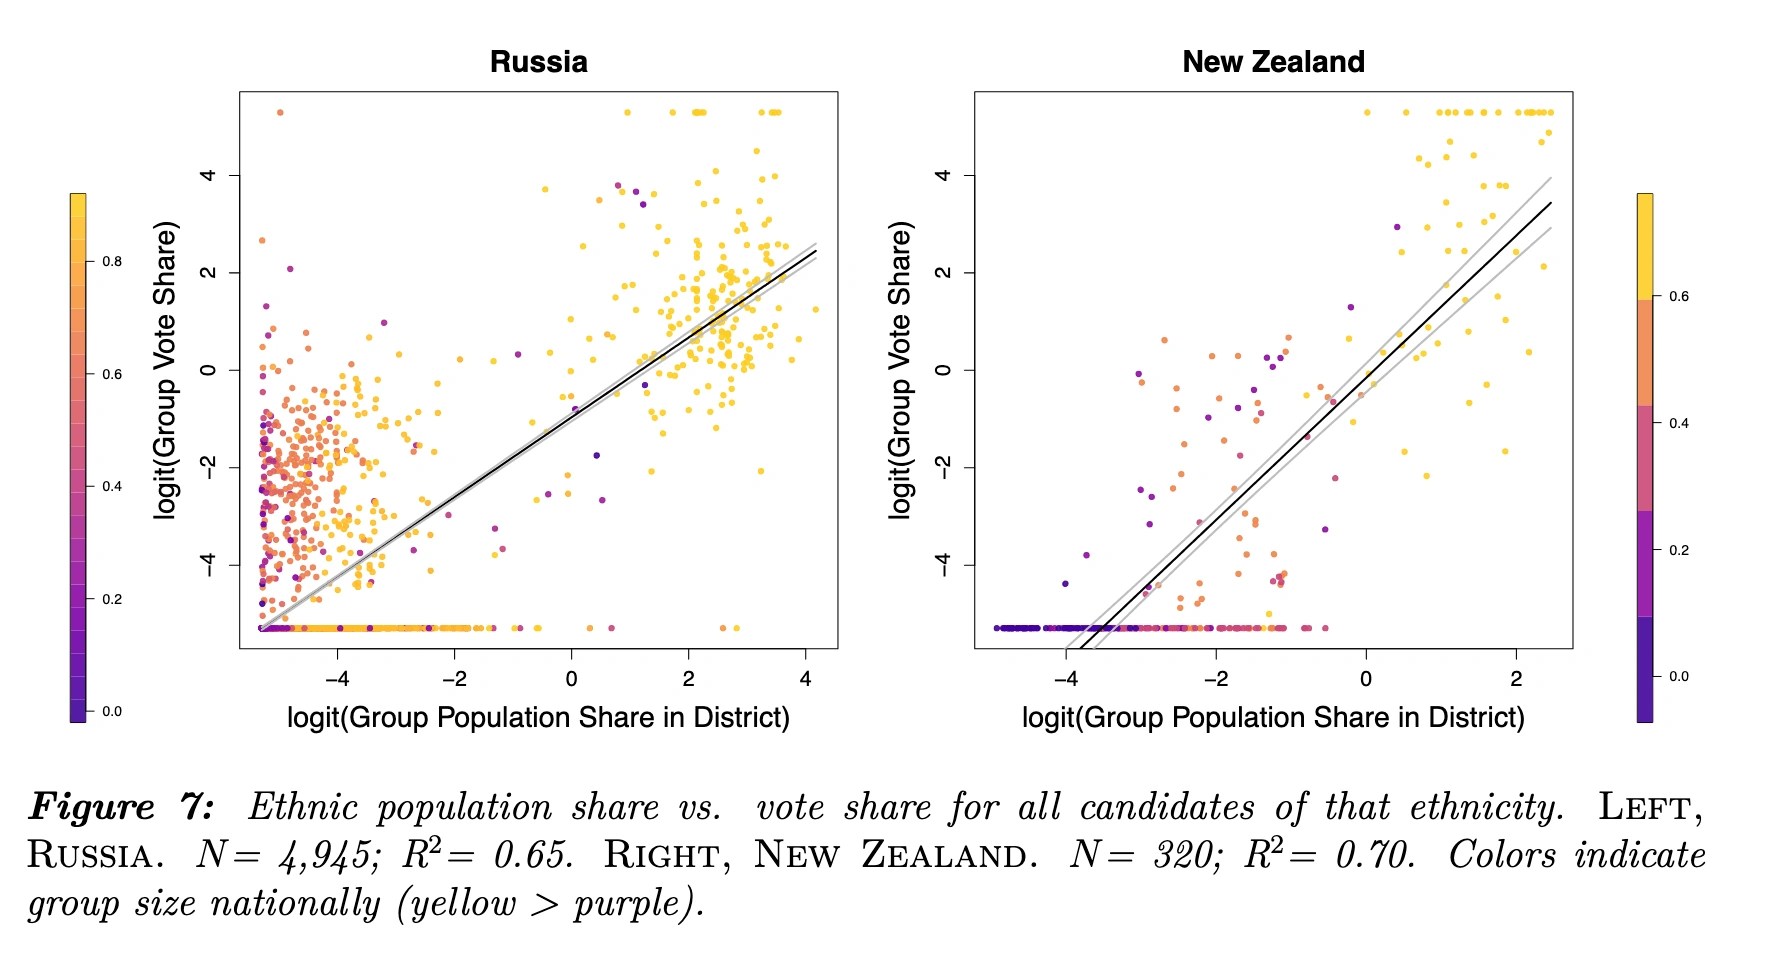
Russia has numerous ethnic groups, many with clear territorial homelands. Using district‑level census data and a machine‑learning classifier for ethnicity from names, the authors reconstruct the ethnic composition of both:
- Each district’s population, and
- The full candidate pool and seat winners in both SMD and MMD tiers.
Results inside SMDs show:
- As a group’s share of a district’s population increases, the probability that it fields candidates – and wins the seat – rises sharply.
- The relationship between group population share and vote share for its candidates is tight, consistent with affinity voting.
- Once a group reaches a high local share (often above ~50–60%), SMDs reliably deliver it representation, even if it is a minority nationally.
New Zealand 2014: dispersed vs concentrated groups under MMP
New Zealand provides a contrasting setting with:
- Māori (partly concentrated, partly dispersed),
- Europeans (majority),
- Pacific Peoples (more urban and concentrated), and
- Asian communities (often urban and dispersed).
Key patterns:
- Like in Russia, the probability that a group’s member wins an SMD seat rises with that group’s local population share.
- Affinity voting appears again: candidates from a group perform better where their group is demographically stronger.
- Under the PR list tier, parties can adjust candidate lists to mirror the country’s diversity, partially offsetting SMD biases.
What do we learn by comparing SMD and MMD candidates and winners?
Across both countries, the authors find:
- The ethnic mix of candidates across SMD and MMD tiers is very similar.
- The ethnic mix of winners closely tracks the mix of candidates in each tier.
- Differences between tiers are therefore driven less by whom parties nominate and more by how votes translate into seats, especially when groups are dispersed vs concentrated.
Using these data, the paper also shows empirically that group size and dispersion interact to determine whether SMD or MMD is slightly more favorable – mirroring the simulation heatmaps.
What are the practical implications for electoral design?
The paper doesn’t argue that electoral rules don’t matter. It argues they matter in specific, predictable ways once you know a group’s size and geographic distribution.
When are multimember districts best for minority representation?
MMDs with PR are especially useful when:
- A group is large but not a majority (e.g., 30–45% of the electorate).
- The group is geographically dispersed rather than tightly clustered.
- You want to improve representation for women and other cross‑cutting identities that don’t map onto a single region.
When are single‑member districts not so bad for minorities?
SMDs can be relatively neutral (or even helpful) when:
- A minority group is highly concentrated in certain districts.
- District boundaries are drawn fairly, so the group’s local majority is not split or diluted.
- There are no strong institutional barriers (e.g., high thresholds, reserved seats that crowd other avenues, or party bans) preventing that group from contesting elections.
Designing rules without overpromising
For policymakers, the main lesson is this:
You can’t fix representational inequalities purely by switching to PR if the underlying problem is geographic concentration, exclusionary party behavior, or broader social barriers.
But if your goal is to boost women’s representation and improve inclusion for dispersed minorities, proportional multimember districts (especially with gender quotas and inclusive list practices) are one of the most powerful institutional levers you have.
FAQs: electoral systems, minorities, and representation
Are proportional systems always better for minorities?
No. Proportional systems with multimember districts consistently help women and some dispersed groups, but many ethnic minorities do just as well under SMDs if they are regionally concentrated. The impact depends on group size and geographic distribution.
Why do women benefit more from PR than many ethnic groups?
Women are a large, nationwide group whose political support doesn’t map neatly onto specific districts. SMDs reward local majorities; PR rewards national‑level shares. That makes PR a better fit for improving women’s descriptive representation.
Does geographic concentration always help minorities?
Concentration is a double‑edged sword. It helps minorities win SMDs in their strongholds, but it also means their representation is tied to district boundaries. If lines are drawn fairly, SMDs can work well; if not, concentrated minorities can be cracked or packed.
What is the difference between descriptive and substantive representation?
Descriptive representation is about who the representatives are (their gender, ethnicity, region). Substantive representation is about what they do (the policies they support). This paper focuses on the descriptive side but is motivated by the idea that the two are often linked.
How can this research inform real‑world electoral reform?
Reform debates often rely on simple slogans like “PR is better for minorities.” This paper offers a more precise guide: map each group’s size and geographic pattern first, then choose institutions that match the representation problem you are trying to solve.
–
–
–
References
@article{gerring2026electoral,
  title={Electoral Rules and Descriptive Representation: A Comprehensive View Across Multiple Identities},
  author={Gerring, John and Alan Hicken and Connor T. Jerzak and Robert Moser and Erzen Öncel},
  journal={Under contract with Cambridge University Press},
  year={2026},
  volume={},
  number={},
  pages={}
}
–
Related Work
@article{gerring2024composition,
  title={The Composition of Descriptive Representation},
  author={Gerring, John and Connor T. Jerzak and Erzen Öncel},
  journal={American Political Science Review},
  year={2024},
  volume={118},
  number={2},
  pages={784-801}
}–