
Authors: Kazuki Sakamoto | Connor Jerzak | Adel Daoud
This post distills the paper “A Scoping Review of Earth Observation and Machine Learning for Causal Inference: Implications for the Geography of Poverty” into an extractable, step-by-step guide: what EO-ML adds beyond prediction, the five main causal workflows found in the literature, and an 8-step protocol you can reuse.
Project resources: GitHub repository | Supplementary materials (DOI)
What problem does the paper solve?
EO (earth observation) data—especially satellite imagery—has already transformed poverty mapping and measurement. But prediction is not the same as explanation. This paper asks a more specific question: how, exactly, are EO data and machine learning being used to support causal inference (estimating cause-and-effect) in poverty-adjacent social science research?
The core contribution is twofold: (1) a scoping review that identifies a small but growing set of studies that are both EO-ML and causal, and (2) a practical protocol that helps researchers decide when EO data is useful for causal work, what data choices matter, and what pitfalls to avoid (like leakage and spatial dependence).
What is EO-ML (and why does it matter for poverty)?
Earth observation (EO) includes satellite, drone, and other remote sensing data that measures Earth’s physical systems (and, indirectly, human activity). EO-ML refers to applying machine learning—often computer vision—to extract patterns from EO data that correlate with outcomes like assets, infrastructure, or living conditions.
Why it matters for poverty research: EO data is globally available and can provide fine-grained spatial coverage where surveys are sparse, missing, delayed, or inconsistent. Done well, EO-ML can help you measure outcomes, proxy confounders, or characterize contexts at a resolution that traditional data collection often can’t match.
How is causal inference different from poverty prediction?
Prediction answers: “Given these inputs, what value is likely?” Causal inference answers: “If we change this, what happens to that—and why?”
In EO-ML poverty mapping, a common goal is imputing poverty-related outcomes from imagery, conceptually: \mathbb{E}\!\left[ Y_i \mid \mathbf{M}_i \right] = f_{\theta}(\mathbf{M}_i) where Y_i is a poverty outcome and \mathbf{M}_i is EO imagery for unit i. Causal work—by contrast—targets estimands like an average treatment effect: \tau = \mathbb{E}[Y_i(1)-Y_i(0)].
The key shift is that your modeling choices must serve an identification strategy (DiD, IV, RDD, experiments, etc.), not just predictive accuracy.
What did the scoping review find?
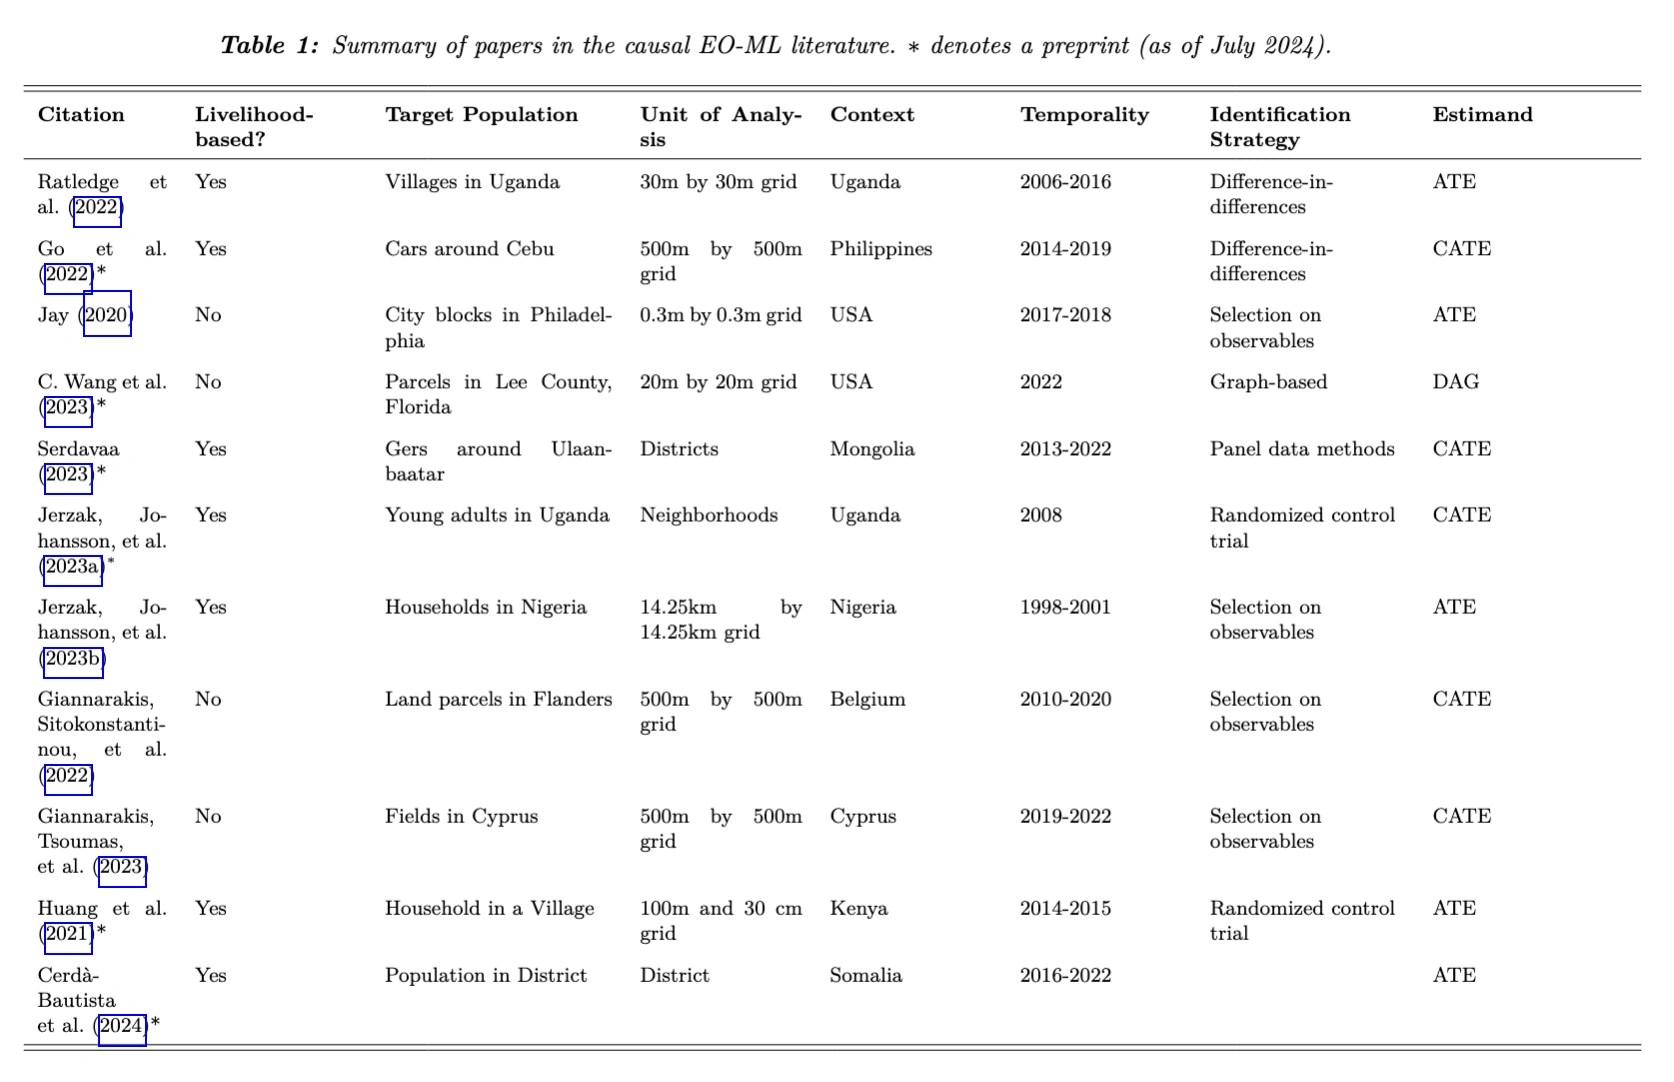
The paper screens a broad set of EO+ML publications and finds that only a small subset truly combine EO data, ML methods, and a causal inference framework in social science settings. In other words: EO-ML is widespread for measurement and prediction, but still comparatively rare for cause-and-effect estimation.
What are the five EO-enabled causal approaches?
The paper synthesizes five “patterns” for integrating EO-ML into causal workflows. If you’re building a study, these can function like templates: pick the one that matches your question and design.
1) Outcome imputation (EO for measuring Y)
Use EO imagery to impute an outcome (like livelihoods or assets) for places/times where surveys are missing, then run a causal design (e.g., DiD). The main risk is that imputation error can distort downstream causal estimates unless handled carefully.
2) Image deconfounding (EO for proxying U)
Use imagery as a proxy for otherwise unobserved confounders (e.g., built environment, remoteness, infrastructure). In practice, this often means using EO-derived features to estimate treatment propensity and reweight or adjust.
3) Treatment effect heterogeneity (EO for “where does it work best?”)
Use EO representations to estimate how treatment effects vary by context. A common estimand is: \tau(\mathbf{m}) = \mathbb{E}[Y_i(1)-Y_i(0)\mid \mathbf{M}_i=\mathbf{m}]. This is useful when policy-makers need targeting rules, not just an average effect.
4) Transportability (EO for generalizing across geographies)
If an intervention was evaluated in one region, EO data can help transfer or adapt findings to new places by measuring comparable context features everywhere. The key caveat: transportability only works if EO features capture the moderators that actually drive effect differences.
5) Image-informed causal discovery (EO as part of structure learning)
EO-derived variables can also be used in causal discovery pipelines to learn plausible directed relationships among multiple factors. This is most useful for hypothesis generation and system mapping—and still requires careful assumptions and validation to support causal claims.
What is the 8-step protocol (copy/paste checklist)?
The paper proposes an 8-step protocol grouped into three phases: Question & identification, EO data, and estimation & uncertainty. Here’s a blog-friendly checklist version:
- Define the causal question: specify treatment A_i, outcome Y_i, target estimand.
- Draw a causal diagram (DAG): list confounders, mediators, moderators, instruments, selection/missingness.
- Decide what EO can measure: which variables are plausibly visible (directly or indirectly) in imagery?
- Direct vs. indirect measurement: are you extracting a measurable quantity from pixels, or predicting a latent construct?
- Select EO data: resolution, bands (RGB vs multispectral), revisit frequency, patch size, time window.
- Audit data issues: leakage risk, spatial dependence, image overlap, cloud-related missingness.
- Choose an image model: pretrained backbones, CNN/ViT, temporal models, representations vs end-to-end.
- Estimate + quantify uncertainty: pick the causal estimator and ensure uncertainty accounts for both sampling and model components.
Which EO data choices matter most?
EO choices quietly determine what your analysis can and cannot identify. The protocol highlights four decisions that routinely dominate results:
- Spatial resolution: e.g., 30m (Landsat) vs 10m (Sentinel) changes what objects and neighborhood structure are visible.
- Temporal resolution: revisit frequency determines whether DiD-style designs have enough pre/post signal.
- Bands and sensors: RGB can show built environment; multispectral bands add vegetation, moisture, and other physical signals.
- Patch size: too small can miss context; too large can create overlap dependencies between units.
One useful mental model is thinking of EO data as a tensor of space, time, and bands: \mathbf{M}_i \in \mathbb{R}^{T \times W \times H \times B}. Changing T, W,H, or B changes what your model can learn and what your estimand depends on.
What can go wrong (and how to reduce risk)?
The paper flags several failure modes that are common in EO-ML causal work—especially when imagery is treated as a black box. Here are the big ones, phrased as “what to watch for”:
- Information leakage: imagery may encode treatment or outcome traces you didn’t intend to condition on, biasing estimates.
- Spatial dependence: nearby units (and their errors) are correlated, so naive splits and naive standard errors can mislead.
- Image overlap: if units share pixels, they aren’t independent—even if your dataset treats them as separate rows.
- Cloud and sensor missingness: missing data is often systematic, not random (and can correlate with geography/outcomes).
- Multi-resolution / multi-phase / multi-source mismatch: combining datasets with different resolutions and time frames can induce noise and bias.
What’s next for “causal EO-ML” research?
The paper’s discussion points to a research agenda that is both methodological and policy-relevant: better leakage detection, better uncertainty quantification, clearer interpretability of EO feature representations, and deeper work on foundation models (especially when representations may include post-treatment information).
The near-term opportunity is simple: many “EO-ML for development” projects still emphasize prediction. The next wave is likely to emphasize decision-relevant causal questions—what works, where it works, for whom, and how findings generalize across contexts.
FAQ
Is satellite imagery “good enough” to measure poverty?
It can be useful for specific proxies (like infrastructure and roofing materials), but “poverty” is often a latent construct. EO-ML is best viewed as a measurement layer whose error must be validated and accounted for.
What’s the fastest causal design to pair with EO-ML?
If you have clean time variation, difference-in-differences is often the most straightforward match—EO can help build consistent outcome series. If you have an experiment, EO is especially powerful for measuring treatment effect heterogeneity and context.
What’s the biggest risk when using foundation models with EO data?
Leakage: pretrained representations can encode information from periods you shouldn’t condition on (including post-treatment imagery), potentially biasing causal estimates.
How do I decide between “direct” and “indirect” EO measurement?
If the construct is physically visible and can be extracted from pixels (e.g., deforestation), it’s closer to direct measurement. If it requires learning a mapping from imagery to a social outcome (e.g., consumption), it’s indirect and will involve prediction error.
How can I reduce spatial leakage in model evaluation?
Use spatially aware splits (e.g., blocked cross-validation), check residual spatial autocorrelation, and audit for overlap in image patches between train and test units.
When does transportability usually fail?
Transportability fails when the new setting differs on effect moderators that the EO features don’t capture (or capture poorly). You need theory to argue which moderators matter—and validation to confirm EO proxies actually measure them.

References
@article{sakamoto2026scoping,
  title={A Scoping Review of Earth Observation and Machine Learning for Causal Inference: Implications for the Geography of Poverty},
  author={Sakamoto, Kazuki and Connor T. Jerzak and Adel Daoud},
  journal={Hall, Ola and Ibrahim Wahab (eds.), Geography of Poverty},
  year={2026},
  volume={},
  pages={},
  publisher={Edward Elgar Publishing (Cheltenham, UK)}
}–
Related Work
@article{pettersson2026debiasing,
  title={Debiasing Machine Learning Predictions for Causal Inference Without Additional Ground Truth Data: 'One Map, Many Trials' in Satellite-Driven Poverty Analysis},
  author={Pettersson, Markus B. and Connor T. Jerzak and Adel Daoud},
  journal={Proceedings of the AAAI Conference on Artificial Intelligence (AAAI-2026), Special Track on AI for Social Impact},
  year={2026},
  volume={40},
  pages={39106-39115},
  publisher={}
}–
@article{daoud2026chinese,
  title={Chinese vs. World Bank Development Projects: Insights from Earth Observation and Computer Vision on Wealth Gains in Africa, 2002-2013},
  author={Daoud, Adel and Cindy Conlin and Connor T. Jerzak},
  journal={World Development},
  year={2026},
  volume={202},
  pages={107328},
  publisher={}
}–
@article{daoud2026+planetary,
  title={Planetary Causal Inference: Understanding the Environment, Society, and Economy through Earth Observation and AI Systems},
  author={Daoud, Adel and Connor T. Jerzak},
  journal={A Book Project},
  year={2026+},
  volume={},
  pages={},
  publisher={Under contract with Cambridge University Press}
}
–
@article{fucheng2025optimizing,
  title={Optimizing Multi-Scale Representations to Detect Effect Heterogeneity Using Earth Observation and Computer Vision: Applications to Two Anti-Poverty RCTs},
  author={Fucheng, Warren Zhu and Connor T. Jerzak and Adel Daoud},
  journal={Proceedings of the Fourth Conference on Causal Learning and Reasoning (CLeaR), Proceedings of Machine Learning Research (PMLR)},
  year={2025},
  volume={},
  pages={},
  publisher={}
}[Video][>]
–
@article{jerzak2024effect,
  title={Effect Heterogeneity with Earth Observation in Randomized Controlled Trials: Exploring the Role of Data, Model, and Evaluation Metric Choice},
  author={Jerzak, Connor T. and Ritwik Vashistha and Adel Daoud},
  journal={ArXiv Preprint},
  year={2024},
  volume={},
  pages={},
  publisher={}
}–
@article{jerzak2023image,
  title={Image-based Treatment Effect Heterogeneity},
  author={Jerzak, Connor T. and Fredrik Johansson and Adel Daoud},
  journal={Proceedings of the Second Conference on Causal Learning and Reasoning (CLeaR), Proceedings of Machine Learning Research (PMLR)},
  year={2023},
  volume={213},
  pages={531-552},
  publisher={}
}–
@article{jerzak2023integrating,
  title={Integrating Earth Observation Data into Causal Inference: Challenges and Opportunities},
  author={Jerzak, Connor T. and Fredrik Johansson and Adel Daoud},
  journal={ArXiv Preprint},
  year={2023},
  volume={},
  pages={},
  publisher={}
}–
@article{jerzak2023causalimages,
  title={CausalImages: An R Package for Causal Inference with Earth Observation, Bio-medical, and Social Science Images},
  author={Jerzak, Connor T. and Adel Daoud},
  journal={ArXiv Preprint},
  year={2023},
  volume={},
  pages={},
  publisher={}
}–