
Authors: Fucheng Warren Zhu | Connor Jerzak | Adel Daoud
How Multi-Scale Representation Concatenation helps estimate heterogeneous treatment effects (CATE) from satellite imagery—with applications to two anti-poverty randomized controlled trials in Peru and Uganda.
What are the key takeaways?
If you’re estimating conditional average treatment effects (CATE) using earth observation (EO) imagery, one image scale is rarely enough. A simple “concatenate representations from multiple scales” trick can boost the heterogeneity signal—without designing new multi-scale neural architectures.
TL;DR
- Problem: Small images capture household details; large images capture neighborhood context. Picking only one is a trade-off.
- Solution: Encode multiple scales separately (e.g., ViT/CLIP embeddings) and concatenate them before CATE estimation.
- Why it’s useful: It can improve detection of treatment effect heterogeneity in EO-based pipelines with limited RCT sample sizes.
- Key lesson: “Bigger satellite image is better” is often wrong—large contexts can increase overlap and wash out unit-level differences.
What is Multi-Scale Representation Concatenation?
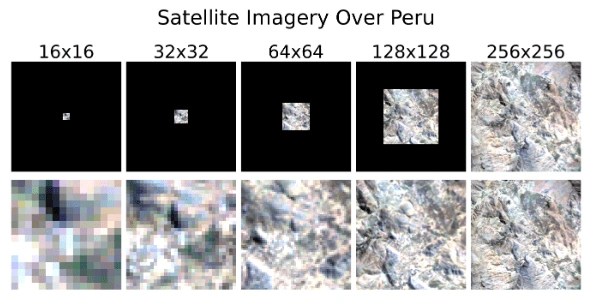
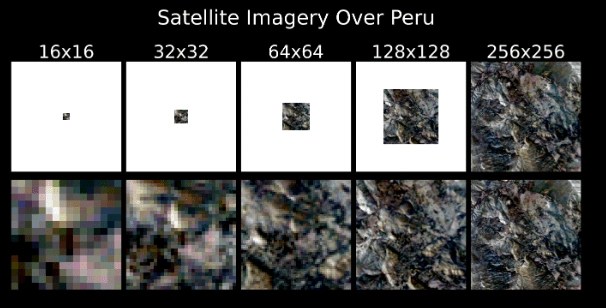
It’s a composable procedure that turns a single-scale EO-to-CATE pipeline into a multi-scale one by stacking (concatenating) embeddings from images cropped at different sizes around the same location.
In the paper’s setting, each unit i has a geolocation. You fetch satellite imagery at multiple crop sizes (scales), embed each image using an encoder (e.g., CLIP-RSICD / ViT variants), then feed the combined feature vector into a CATE estimator (e.g., Causal Forest).
CATE definition. \tau(m) \;=\; \mathbb{E}\!\left[Y(1)-Y(0)\mid M=m\right]
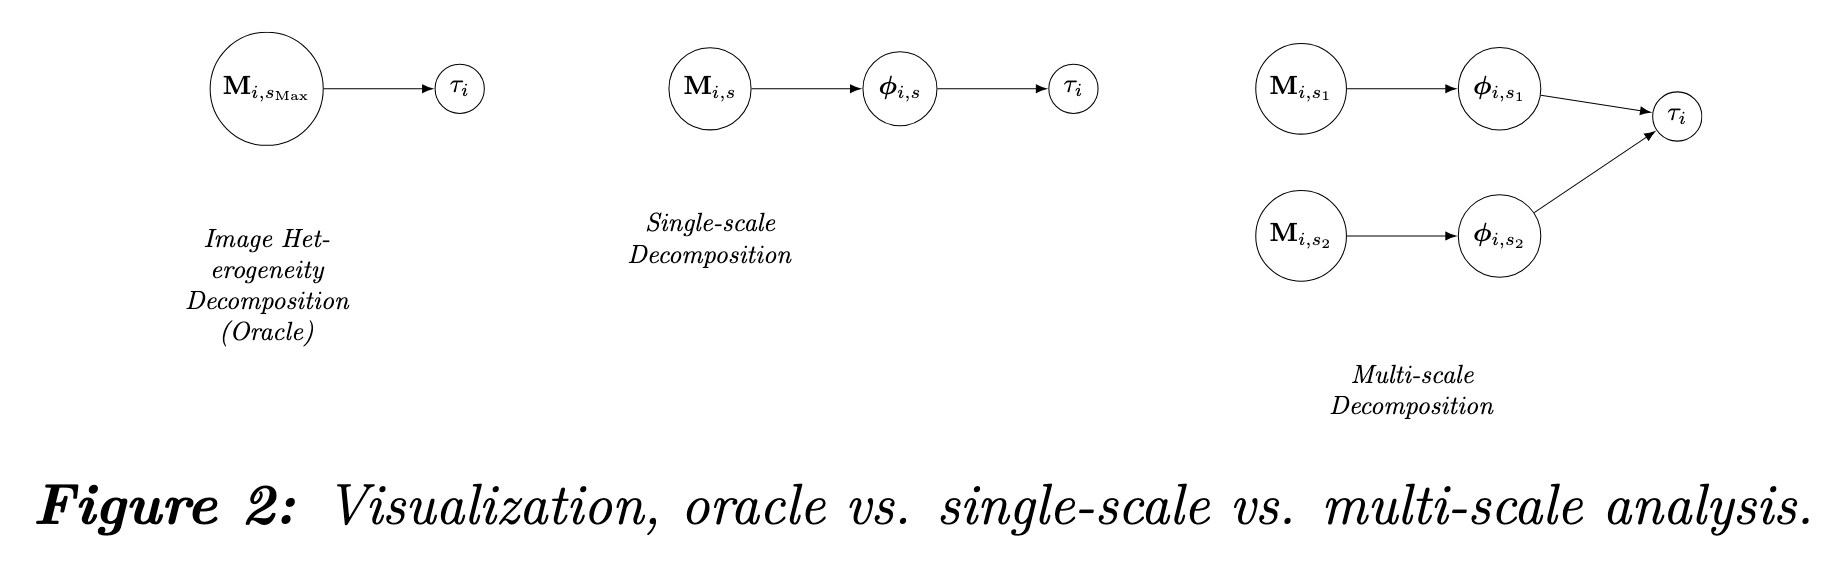
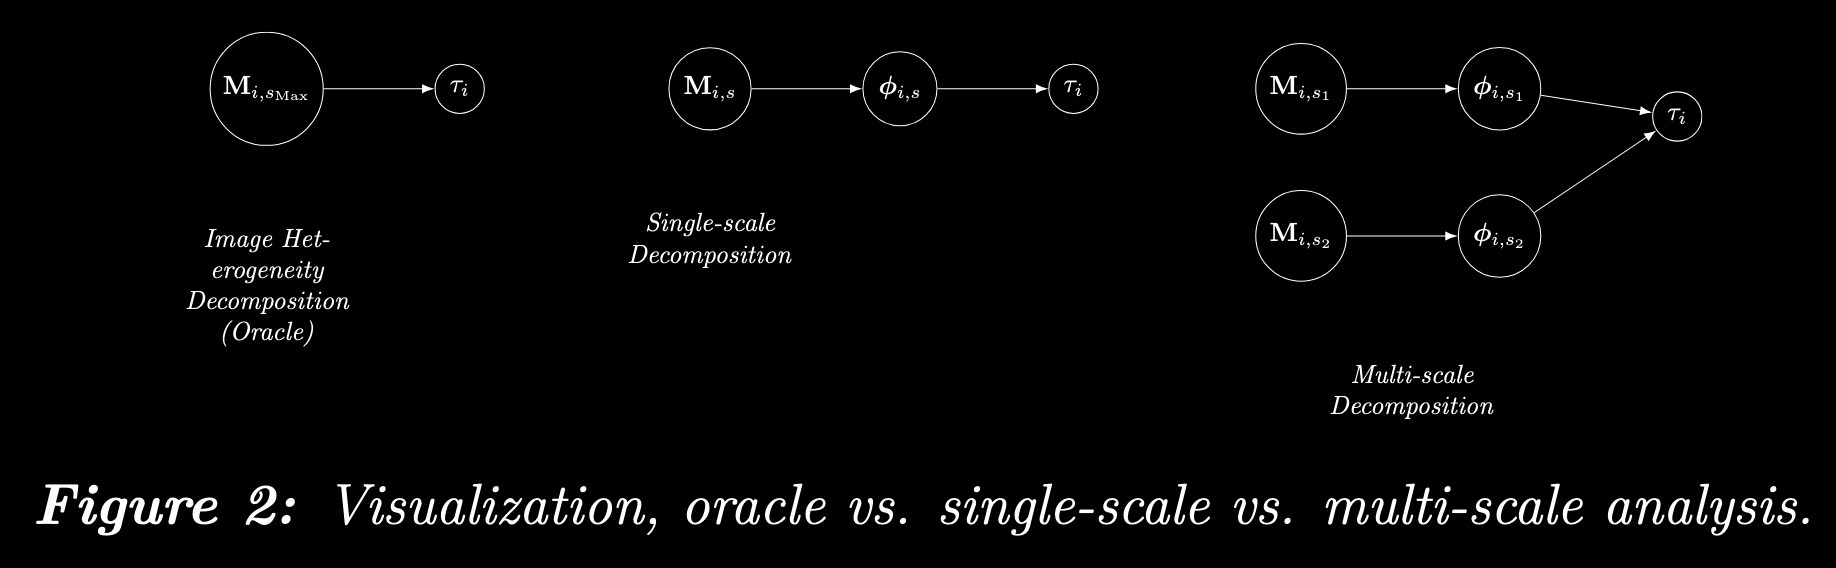
Multi-scale embedding by concatenation.
\phi_{i,s_1,s_2} \;=\; \big(f_{s_1}(M_{i,s_1}),\; f_{s_2}(M_{i,s_2})\big)
where fs is an image encoder at scale s, and Mi,s is the image crop centered at unit i.
What’s nice about this approach: you can reuse your existing image encoder(s) and your existing causal estimator. No custom multi-scale network architecture is required.
Why does image scale matter for effect heterogeneity?
Because the “signal” that explains why treatment effects differ across units can live at multiple spatial scales—from a roof or plot boundary (local) to roads, rivers, and market access (contextual).
- Small crops are better for fine-grained unit features (household assets, local land use).
- Large crops are better for broader context (neighborhood infrastructure, geography).
- Single-scale pipelines force you to choose one—and that choice can hide heterogeneity.
Small vs. large (and why “just go bigger” fails): Larger crops can cause more overlap between nearby units (especially within villages), which can make embeddings look more similar and reduce your ability to distinguish unit-level differences.
How does the method work, step-by-step?
Fetch multiple crops per unit, encode each crop, concatenate embeddings, optionally reduce dimensionality, then fit a heterogeneity-aware causal model (like a Causal Forest) on the resulting feature vectors.
- Choose scales (example set used in the paper spans small to large contexts).
- Fetch imagery centered on each unit’s coordinates at each chosen scale.
- Encode images at each scale using a pre-trained or fine-tuned EO encoder.
- Concatenate the scale-specific embeddings into one feature vector.
- (Optional) Compress the concatenated vector (e.g., PCA) to reduce noise/overfitting risk.
- Estimate CATE using a method like Causal Forest that can model heterogeneous effects.
- Select the best scale combo via grid search using a heterogeneity metric.
# Pseudocode sketch
for s in scales:
  M[i,s] = fetch_image(x_i, size=s)
  z[i,s] = encoder_s(M[i,s])

phi[i,s1,s2] = concat(z[i,s1], z[i,s2])  # Multi-Scale Representation Concatenation
phi_reduced = PCA(phi)                   # optional

tau_hat[i] = causal_forest(phi_reduced, W, Y)  # CATE
score = RATE_ratio(tau_hat, W, Y)              # model selection
Best for: EO-based causal inference in small-to-medium data regimes (like many RCTs) where training a bespoke multi-scale deep model is impractical.
How do they evaluate without ground-truth CATE?
They use RATE Ratio, which summarizes how much better a model can target “high responders” compared to treating at random—without needing individual-level true treatment effects.
RATE Ratio (conceptually). \text{RATE Ratio} \;=\; \frac{\text{RATE}}{\text{sd(RATE)}}
Intuition: if your estimated CATE ranking is informative, then prioritizing units with higher predicted effects should produce a meaningful gain over the baseline average effect. RATE Ratio is designed to quantify that signal in a statistically principled way.
Plus: the paper also uses simulations (where the causal mechanism is known) to validate that multi-scale concatenation recovers heterogeneity signals that single-scale representations miss.
What do the results say (in plain language)?
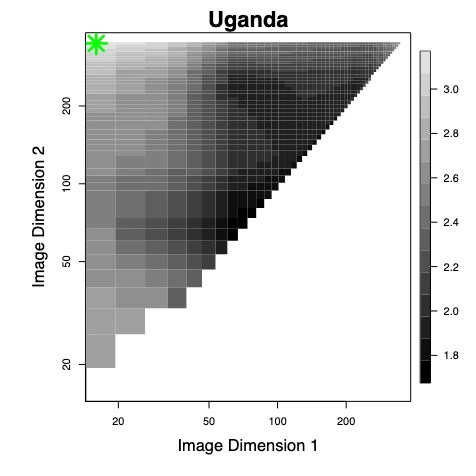
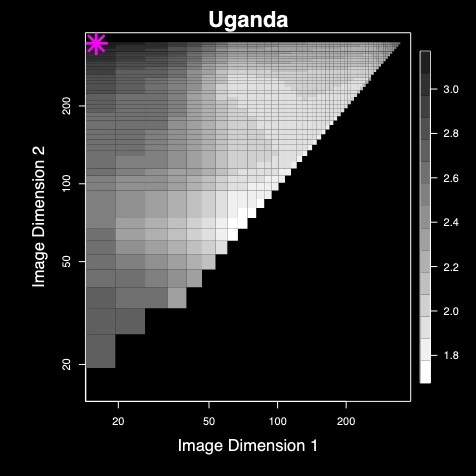
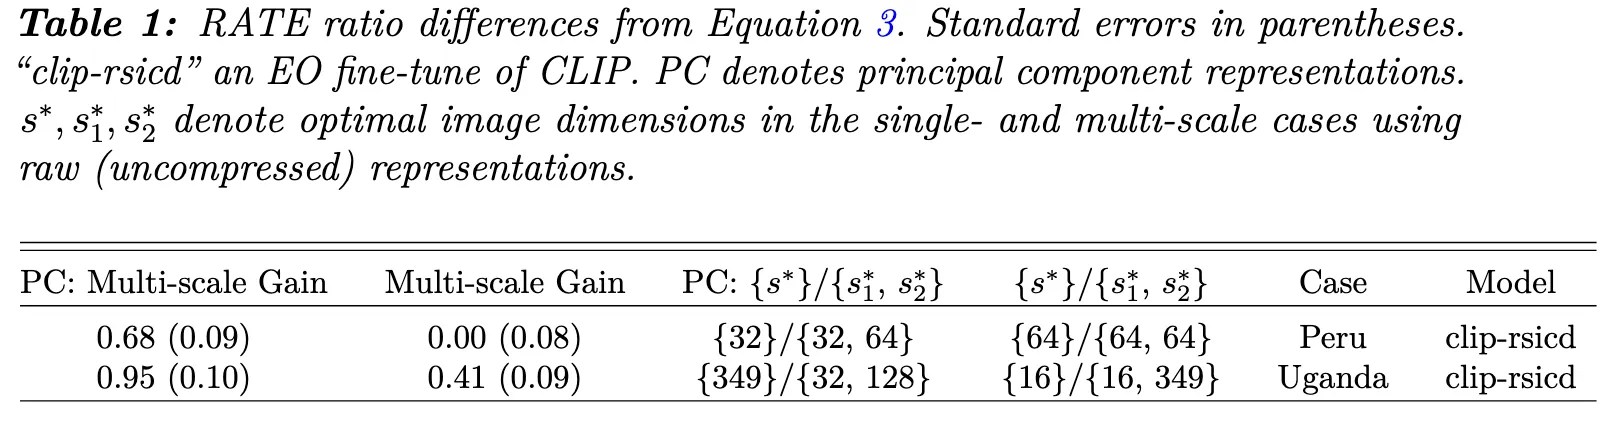
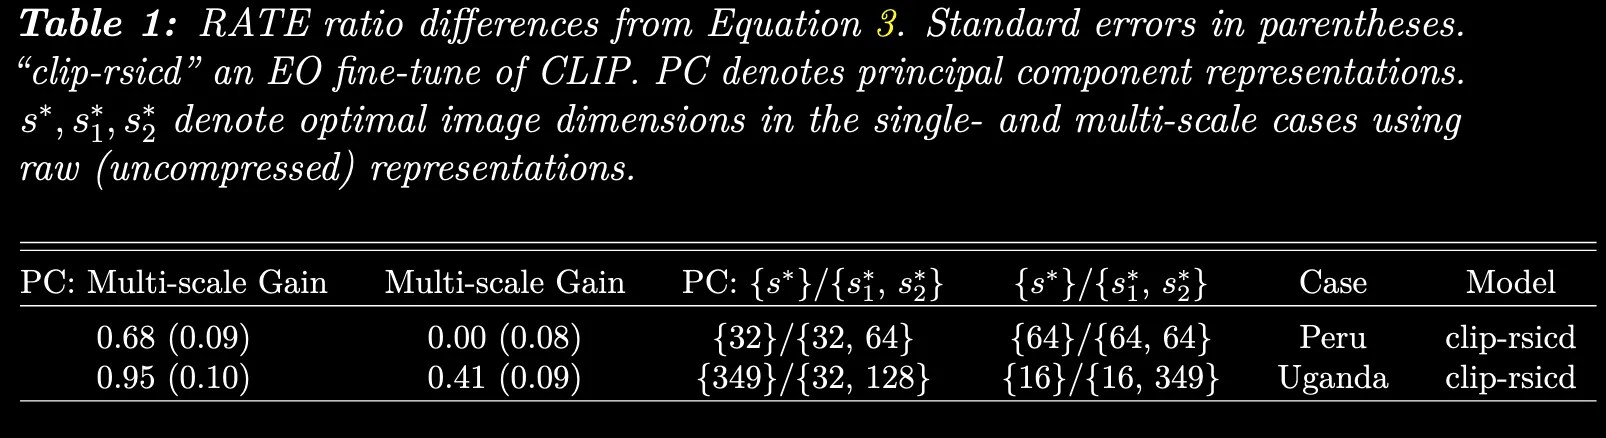
Multi-scale concatenation improves—or at least does not harm—heterogeneity detection, with especially strong evidence in the Uganda setting. Dimensionality reduction on concatenated features can further improve performance.
Result pattern #1: “Small + large” beats “only large”
Across the RCT analyses, the best-performing configurations tend to pair a small or medium crop with a larger crop. This matches the central hypothesis: heterogeneity-relevant information is distributed across scales.
Result pattern #2: Bigger is not always better
A striking finding is that using the largest available image context is not consistently optimal—especially once you’re doing multi-scale selection. Large contexts can introduce overlap and blur unit-level differences.
Result pattern #3: More scales help up to a point
When scaling beyond two crops, average heterogeneity signal increases with the number of concatenated scales, peaking around a moderate number of scales before plateauing—suggesting diminishing returns once the representation becomes redundant or too high-dimensional.
Practical implication: If your EO-to-CATE pipeline currently uses a single crop size, the simplest upgrade is to add one additional scale (local + contextual), concatenate embeddings, and run the same causal model you already trust.
How can you implement this in your own pipeline?
Treat multi-scale concatenation as a modular “feature engineering” layer: it sits between image fetching and your CATE estimator, and it works with almost any encoder + causal model combination.
A minimal implementation checklist
- Pick 2–5 scales that map to plausible mechanisms (e.g., household, neighborhood, region).
- Keep resolution fixed when comparing scales (so “scale” truly means context size).
- Use the same encoder across scales to start (simplifies debugging), then experiment with specialized encoders.
- Control dimensionality: concatenation increases feature size; PCA (or similar) can stabilize downstream causal estimation.
- Evaluate with a heterogeneity metric that matches your setting (RATE/Qini-style if no ground-truth CATE).
Multi-scale concatenation vs. a custom multi-scale neural net
- Concatenation is best when you want a fast, interpretable, low-risk upgrade without training a new architecture.
- Custom multi-scale models are best when you have large labeled datasets and can afford a longer model design cycle.
Resources: If you want to replicate or adapt the method, start with the paper and the public code repo: github.com/AIandGlobalDevelopmentLab/MultiScaler.
Want the 5-minute walkthrough?
The companion video summarizes the motivation, the multi-scale concatenation procedure, the simulations, and the Peru/Uganda results.
What are the limitations and ethics considerations?
Multi-scale concatenation is simple, but it doesn’t remove core causal assumptions—and higher-resolution imagery introduces privacy trade-offs.
- Causal identification: Results assume standard causal inference conditions (e.g., SUTVA and identification assumptions appropriate to the study design).
- Resolution limits: Low-resolution imagery may reduce the usefulness of very small scales; high-resolution imagery can increase privacy risk.
- Dimensionality + overfitting: Concatenation can inflate feature dimension; compression and careful validation matter.
- Generalizability: The method is validated on two anti-poverty RCT contexts; performance can differ across regions, sensors, and outcomes.
Ethical note: If you’re using geolocation-linked imagery, it is important to treat privacy considerations with great care—especially when household-level locations are involved.
FAQ
Does this require a Vision Transformer (ViT) or CLIP?
No. The key idea is “multi-scale embeddings + concatenation.” You can plug in any image encoder (foundation model, self-supervised model, fine-tuned model) and any downstream CATE estimator.
How many scales should I concatenate?
Start with two: one local scale and one contextual scale. If you have enough data and compute, add more scales and check for diminishing returns using your evaluation metric.
When should I use PCA (or other dimensionality reduction)?
If concatenation doubles (or triples) your feature dimension and your sample size is limited, dimensionality reduction can improve stability and reduce noise for the causal model.
Is “largest image wins” ever correct?
Sometimes. But large crops can increase overlap between units and compress important local differences into a fixed-size embedding. In many EO settings, mixing scales is safer than betting on a single “best” scale.
References
@article{zhu2025optimizing,
  title={Optimizing Multi-Scale Representations to Detect Effect Heterogeneity Using Earth Observation and Computer Vision: Application to Two Anti-Poverty RCTs},
  author={Zhu, Fucheng Warren and Connor T. Jerzak and Adel Daoud},
  journal={Proceedings of the Fourth Conference on Causal Learning and Reasoning (CLeaR)},
  year={2025},
  volume={},
  number={},
  pages={}
}Also featured at the Causal Representation Learning Workshop at the 38th Conference on Neural Information Processing Systems (NeurIPS 2024).
–
Related Work
@article{pettersson2026debiasing,
  title={Debiasing Machine Learning Predictions for Causal Inference Without Additional Ground Truth Data: 'One Map, Many Trials' in Satellite-Driven Poverty Analysis},
  author={Pettersson, Markus and Connor T. Jerzak and Adel Daoud},
  journal={Proceedings of the AAAI Conference on Artificial Intelligence (AAAI-2026)},
  year={2026},
  volume={},
  pages={39106-39115},
  publisher={}
}–
@article{daoud2026chinese,
  title={Chinese vs. World Bank Development Projects: Insights from Earth Observation and Computer Vision on Wealth Gains in Africa, 2002-2013},
  author={Daoud, Adel and Cindy Conlin and Connor T. Jerzak},
  journal={World Development},
  year={2026},
  volume={202},
  pages={107328},
  publisher={}
}–
@article{daoud2026+planetary,
  title={Planetary Causal Inference: Understanding the Environment, Society, and Economy through Earth Observation and AI Systems},
  author={Daoud, Adel and Connor T. Jerzak},
  journal={A Book Project},
  year={2026+},
  volume={},
  pages={},
  publisher={Under contract with Cambridge University Press}
}
–
@article{jerzak2024effect,
  title={Effect Heterogeneity with Earth Observation in Randomized Controlled Trials: Exploring the Role of Data, Model, and Evaluation Metric Choice},
  author={Jerzak, Connor T. and Ritwik Vashistha and Adel Daoud},
  journal={ArXiv Preprint},
  year={2024},
  volume={},
  pages={},
  publisher={}
}–
@article{jerzak2023image,
  title={Image-based Treatment Effect Heterogeneity},
  author={Jerzak, Connor T. and Fredrik Johansson and Adel Daoud},
  journal={Proceedings of the Second Conference on Causal Learning and Reasoning (CLeaR), Proceedings of Machine Learning Research (PMLR)},
  year={2023},
  volume={213},
  pages={531-552},
  publisher={}
}–
@article{sakamoto2024scoping,
  title={A Scoping Review of Earth Observation and Machine Learning for Causal Inference: Implications for the Geography of Poverty},
  author={Sakamoto, Kazuki and Connor T. Jerzak and Adel Daoud},
  journal={Hall, Ola and Ibrahim Wahab (eds.), Geography of Poverty},
  year={2024},
  volume={},
  pages={},
  publisher={Edward Elgar Publishing (Cheltenham, UK)}
}–
@article{jerzak2023integrating,
  title={Integrating Earth Observation Data into Causal Inference: Challenges and Opportunities},
  author={Jerzak, Connor T. and Fredrik Johansson and Adel Daoud},
  journal={ArXiv Preprint},
  year={2023},
  volume={},
  pages={},
  publisher={}
}–
@article{jerzak2023causalimages,
  title={CausalImages: An R Package for Causal Inference with Earth Observation, Bio-medical, and Social Science Images},
  author={Jerzak, Connor T. and Adel Daoud},
  journal={ArXiv Preprint},
  year={2023},
  volume={},
  pages={},
  publisher={}
}–