
Authors: Connor Jerzak | Fredrik Johansson | Adel Daoud
TL;DR: If you run an RCT and want to know where or for whom the treatment works best—but your baseline survey covariates miss neighborhood history, terrain, infrastructure, or context—this paper shows how to estimate interpretable image-based CATEs using a probabilistic deep learning model that (1) clusters images by treatment-effect distributions and (2) highlights which image regions drive those clusters.
What is an image-based CATE?
An image-based CATE is the expected treatment effect conditional on an image (e.g., a satellite tile around a village, or a diagnostic scan for a patient), instead of conditioning only on tabular baseline covariates.
The classic causal-inference setup uses potential outcomes: Y_i(1),\;Y_i(0), unit-level effect \tau_i = Y_i(1)-Y_i(0), and the population average: \mathrm{ATE}=\mathbb{E}[Y(1)-Y(0)].
Heterogeneity asks for conditional effects: \tau(g)=\mathbb{E}[Y(1)-Y(0)\mid G=g]. When the conditioning set is an image tensor M, the image CATE is: \tau(m)=\mathbb{E}[Y(1)-Y(0)\mid M=m].
The big challenge is interpretability: images are high-dimensional and rarely annotated, so you need a model that can both learn from images and communicate what it learned in a human-usable form.
Why use satellite imagery for treatment effect heterogeneity (instead of only baseline covariates)?
Baseline covariates in RCTs are often collected once, near the experiment start—so they can miss historical, geographic, and neighborhood-level context that shapes how an intervention works.
- Images can capture context that surveys don’t: roads, terrain, vegetation, water access, settlement patterns, and more.
- Images scale beyond the sample: if you can link units to locations, you can often obtain imagery for places outside the experimental sample and predict how they might respond.
- Images can support transportability: you can form predictive distributions for effects in unseen locations, when assumptions about selection and shift are reasonable.
What does the paper contribute (in plain English)?
Jerzak, Johansson, and Daoud introduce a probabilistic deep learning framework that clusters images into a small number of “image types,” where each type corresponds to a distinct distribution of treatment effects.
Compared to “predict effects first, cluster later” workflows, their approach clusters images in a way that is directly tied to treatment-effect heterogeneity—while also quantifying uncertainty: uncertainty in (1) cluster membership and (2) treatment effects within clusters.
What problems does this solve?
- Interpretability: summarize complex image-driven heterogeneity using K clusters (often K ≈ 2–5 for human decision-making).
- Uncertainty: get posterior distributions for cluster probabilities and effect distributions.
- Actionability: generate predicted effect maps for areas without RCT outcomes (policy targeting).
How the Image-Type Effect Cluster Model works
The model uses Bayesian CNNs to (1) predict baseline outcomes from an image and (2) predict the probability that an image belongs to each “effect cluster,” then assigns each cluster its own treatment-effect distribution.
Key idea: an interpretable “image type” variable
The paper’s target summary estimand is an image-type CATE: \tau(z)=\mathbb{E}[Y(1)-Y(0)\mid Z=z], where Z\in\{1,\dots,K\} is a latent cluster label learned from images.
Generative story
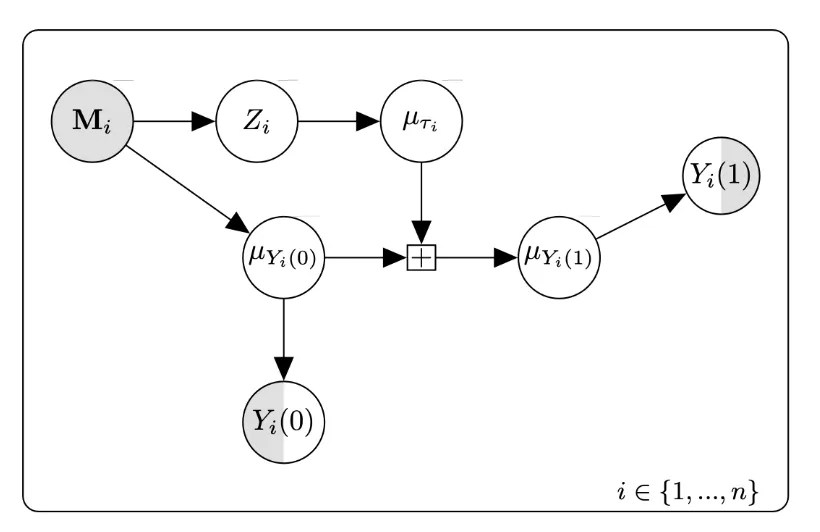
- Image → cluster probabilities: a Bayesian CNN maps the image to \Pr(Z=k\mid M).
- Cluster → effect distribution: each cluster has a distribution over treatment effects (not just a single number).
- Image → baseline outcome: another Bayesian CNN predicts \mathbb{E}[Y(0)\mid M].
- Treatment adds effect: outcome under treatment is baseline plus the (cluster-driven) effect.
In the simplest “effect cluster” variant, the cluster-level mean effect summarizes the image-type CATE: \tau(z)=\mu_{\tau,z}.
Interpretability: clusters + salience maps
You interpret the model through (1) a small set of cluster effect distributions and (2) salience maps that show which image regions influence cluster assignment.
1) Cluster summaries that a policymaker can actually use
Instead of “a million pixel features,” you get K clusters, each with an estimated effect distribution (mean and variance). This is the bridge from deep learning to decision-making.
2) Salience maps: what in the image is driving the effect type?
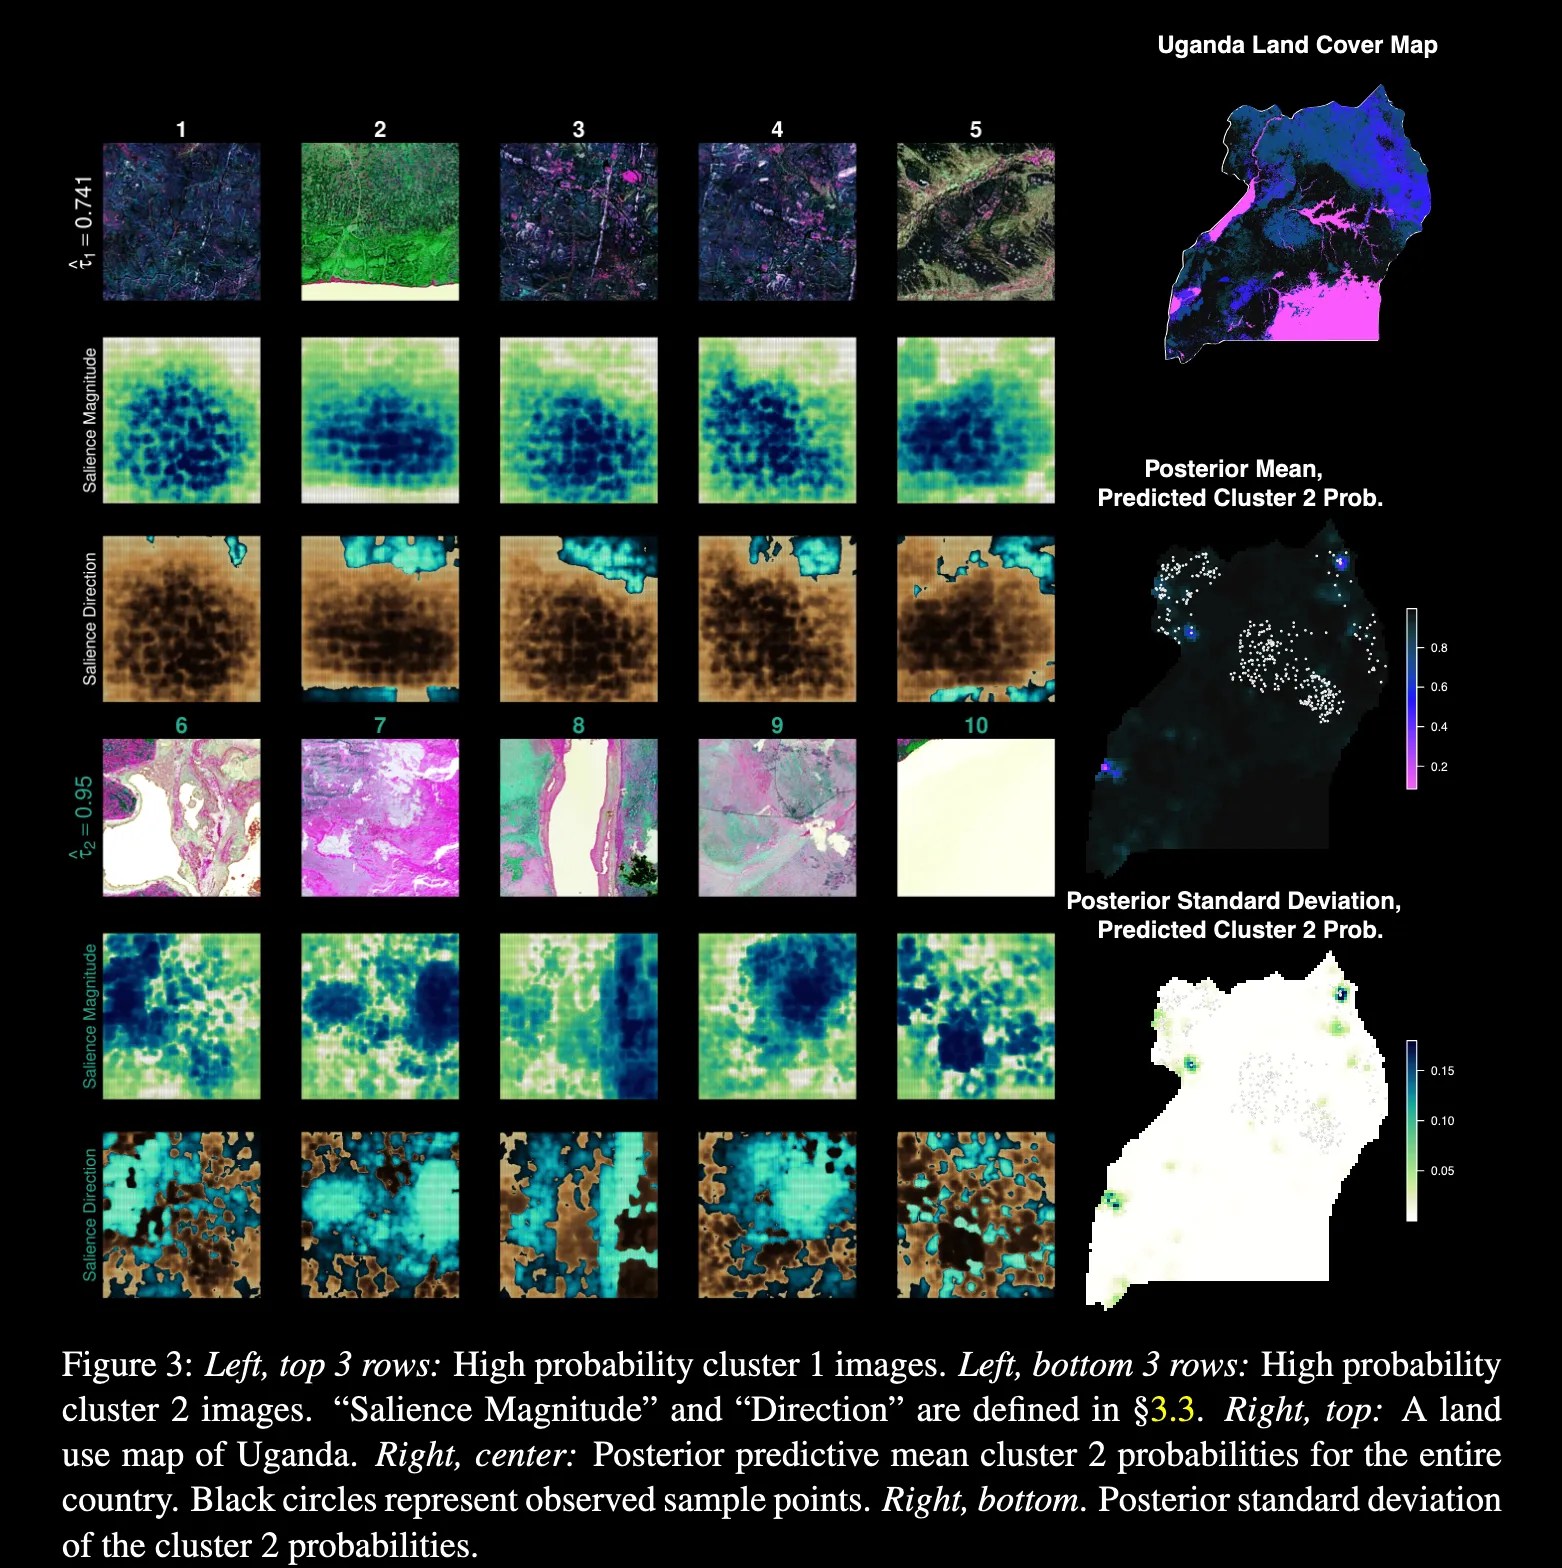
The paper proposes sensitivity measures based on derivatives of cluster probabilities with respect to pixels—yielding salience “heatmaps.” One magnitude form is: s^{\mathrm{Magnitude}}_{whk}=\sqrt{\sum_{c=1}^{C}\left(\frac{\partial\ \mathbb{E}[\Pr(Z=k\mid M)]}{\partial m_{whc}}\right)^2}.
Translation: if you perturb that region of the image, how much does the probability of belonging to cluster k change?
Simulation results: post-hoc TARNet vs probabilistic clustering
In simulations, the paper finds that the parsimonious Image-Type Effect Cluster Model more reliably recovers the underlying effect clusters—especially as noise increases—than post-hoc clustering of TARNet-style predictions.
Post-hoc approach (baseline) vs direct clustering (proposed)
- Post-hoc (TARNet + k-means): first estimate \hat{\tau}(M), then cluster predicted effects afterwards.
- Proposed: learn cluster assignments as part of a single probabilistic model that directly targets heterogeneous effects.
Why this matters: post-hoc pipelines can “compound approximation error” (noise in potential outcome models becomes noise in clustering), while integrated clustering can be more stable and uncertainty-aware.
Uganda application: what heterogeneity did the images reveal?
In the Uganda Youth Opportunities Program replication, the model finds distinct image-linked clusters where treatment effects differ—visually associated with differences in terrain and transportation connectivity—and then produces a national map of predicted cluster probabilities beyond the RCT sample.
Data + imagery choices (what they used)
- Setting: an anti-poverty RCT in northern Uganda (Youth Opportunities Program).
- Outcome: an aggregate measure of skilled labor measured two years post-treatment.
- Imagery: Landsat-based tiles using green, near-infrared (NIR), and short-wave infrared (SWIR) bands.
What the clusters look like (intuitively)
The paper reports that lower effects are associated with imagery reflecting harsher terrain and less developed transportation networks—consistent with the idea that returns to skill and enterprise depend on connectivity and local economic feasibility.
Transporting the result: predicting beyond observed villages
A standout output is a posterior predictive map: for each location, the model estimates the probability of belonging to (for example) the “high responder” cluster. This turns an RCT into a tool for geographic decision support—so long as you think carefully about extrapolation and distribution shift.
Practical guidance (what to do, what to avoid)
Treat this as a causal heterogeneity tool for RCTs, then stress-test it like you would any transportability or ML-to-policy pipeline: check uncertainty, check shift, check interpretability.
Best practices
- Start with small K: the paper’s application uses K = 2 when additional clusters become highly correlated.
- Inspect uncertainty: review images/areas with high posterior standard deviation for cluster probabilities.
- Use orthogonalization when needed: if you want “image-specific” heterogeneity beyond tabular covariates, residualize outcomes on
Xbefore clustering. - Be explicit about shift: transporting predictions across geography is powerful—but only as credible as your assumptions about selection and distribution differences.
Common failure modes
- Overconfident clusters: if probabilities collapse to 0/1 too quickly, increase training steps, simplify architecture, or adjust Monte Carlo settings.
- Garbage in, garbage out: geocoding errors, cloud artifacts, or mismatched timestamps can swamp the heterogeneity signal.
- Misinterpretation: salience maps show sensitivity for cluster assignment, not a “causal mechanism proof.” Use them as hypotheses generators.
FAQ
Does this identify causal effects from images in observational studies?
The core paper focuses on the RCT setting where treatment is randomized (so identification is not the primary hurdle). Observational extensions require careful adjustment and additional assumptions.
Image CATE vs tabular CATE: what’s the difference in practice?
Tabular CATE answers “who responds differently, based on measured covariates.” Image CATE answers “which contexts respond differently, based on visual patterns,” including neighborhood and geographic signals that may not be in surveys.
Why cluster at all—why not just output a continuous effect prediction per image?
Clusters trade precision for interpretability: a small number of effect types is easier to communicate, audit, and use in targeting decisions. You also get cluster-level effect distributions and uncertainty.
How should I choose the number of clusters K?
Start small (2–5), examine whether additional clusters are stable and distinct, and check whether cluster probabilities become redundant or highly correlated as K grows.
What kinds of images can I use?
Satellite imagery is the headline example, but the framework can apply to medical imaging (X-ray/MRI), street view, aerial photography, and other pre-treatment images linked to units.



–
References
@article{jerzak2023image,
  title={Image-based Treatment Effect Heterogeneity},
  author={Jerzak, Connor T. and Fredrik Johansson and Adel Daoud},
  journal={Proceedings of the Second Conference on Causal Learning and Reasoning (CLeaR), Proceedings of Machine Learning Research (PMLR)},
  year={2023},
  volume={213},
  pages={531-552},
  publisher={}
}[Summary PDF]
–
Related Work
@article{fucheng2025optimizing,
  title={Optimizing Multi-Scale Representations to Detect Effect Heterogeneity Using Earth Observation and Computer Vision: Applications to Two Anti-Poverty RCTs},
  author={Fucheng, Warren Zhu and Connor T. Jerzak and Adel Daoud},
  journal={Proceedings of the Fourth Conference on Causal Learning and Reasoning (CLeaR), Proceedings of Machine Learning Research (PMLR)},
  year={2025},
  volume={},
  pages={},
  publisher={}
}[Video][>]
–
@article{daoud2026chinese,
  title={Chinese vs. World Bank Development Projects: Insights from Earth Observation and Computer Vision on Wealth Gains in Africa, 2002-2013},
  author={Daoud, Adel and Cindy Conlin and Connor T. Jerzak},
  journal={World Development},
  year={2026},
  volume={202},
  pages={107328},
  publisher={}
}–
@article{daoud2026+planetary,
  title={Planetary Causal Inference: Understanding the Environment, Society, and Economy through Earth Observation and AI Systems},
  author={Daoud, Adel and Connor T. Jerzak},
  journal={A Book Project},
  year={2026+},
  volume={},
  pages={},
  publisher={Under contract with Cambridge University Press}
}
–
@article{pettersson2026debiasing,
  title={Debiasing Machine Learning Predictions for Causal Inference Without Additional Ground Truth Data: 'One Map, Many Trials' in Satellite-Driven Poverty Analysis},
  author={Pettersson, Markus and Connor T. Jerzak and Adel Daoud},
  journal={Proceedings of the AAAI Conference on Artificial Intelligence (AAAI-26)},
  year={2026},
  volume={},
  pages={},
  publisher={}
}–
@article{jerzak2024effect,
  title={Effect Heterogeneity with Earth Observation in Randomized Controlled Trials: Exploring the Role of Data, Model, and Evaluation Metric Choice},
  author={Jerzak, Connor T. and Ritwik Vashistha and Adel Daoud},
  journal={ArXiv Preprint},
  year={2024},
  volume={},
  pages={},
  publisher={}
}–
@article{sakamoto2024scoping,
  title={A Scoping Review of Earth Observation and Machine Learning for Causal Inference: Implications for the Geography of Poverty},
  author={Sakamoto, Kazuki and Connor T. Jerzak and Adel Daoud},
  journal={To appear in: Hall, Ola and Ibrahim Wahab (eds.), Geography of Poverty},
  year={2024},
  volume={},
  pages={},
  publisher={Edward Elgar Publishing (Cheltenham, UK)}
}–
@article{jerzak2023integrating,
  title={Integrating Earth Observation Data into Causal Inference: Challenges and Opportunities},
  author={Jerzak, Connor T. and Fredrik Johansson and Adel Daoud},
  journal={ArXiv Preprint},
  year={2023},
  volume={},
  pages={},
  publisher={}
}–
@article{jerzak2023causalimages,
  title={CausalImages: An R Package for Causal Inference with Earth Observation, Bio-medical, and Social Science Images},
  author={Jerzak, Connor T. and Adel Daoud},
  journal={ArXiv Preprint},
  year={2023},
  volume={},
  pages={},
  publisher={}
}–