
Overview: These papers explore the integration of image data from satellites in causal inference. Applications include use of satellite image data to improve the understanding of treatment effect heterogeneity in the context of anti-poverty programs, of the average effect analysis in the context of global-scale observational inference, and of causal mechanisms underlying social dynamics, public policy, and economic change.
More: PlanetaryCausalInference.org
–
@article{daoud2026+planetary,
  title={Planetary Causal Inference: Understanding the Environment, Society, and Economy through Earth Observation and AI Systems},
  author={Daoud, Adel and Connor T. Jerzak},
  journal={A Book Project},
  year={2026+},
  volume={},
  pages={},
  publisher={Under contract with Cambridge University Press}
}
–
@article{daoud2026chinese,
  title={Chinese vs. World Bank Development Projects: Insights from Earth Observation and Computer Vision on Wealth Gains in Africa, 2002-2013},
  author={Daoud, Adel and Cindy Conlin and Connor T. Jerzak},
  journal={World Development},
  year={2026},
  volume={202},
  pages={107328},
  publisher={}
}–
@article{fucheng2025optimizing,
  title={Optimizing Multi-Scale Representations to Detect Effect Heterogeneity Using Earth Observation and Computer Vision: Applications to Two Anti-Poverty RCTs},
  author={Fucheng, Warren Zhu and Connor T. Jerzak and Adel Daoud},
  journal={Proceedings of the Fourth Conference on Causal Learning and Reasoning (CLeaR), Proceedings of Machine Learning Research (PMLR)},
  year={2025},
  volume={},
  pages={},
  publisher={}
}[Video][>]
–
@article{pettersson2026debiasing,
  title={Debiasing Machine Learning Predictions for Causal Inference Without Additional Ground Truth Data: 'One Map, Many Trials' in Satellite-Driven Poverty Analysis},
  author={Pettersson, Markus B. and Connor T. Jerzak and Adel Daoud},
  journal={Proceedings of the AAAI Conference on Artificial Intelligence (AAAI-2026)},
  year={2026},
  volume={40},
  pages={39106-39115},
  publisher={}
}–
@article{jerzak2024effect,
  title={Effect Heterogeneity with Earth Observation in Randomized Controlled Trials: Exploring the Role of Data, Model, and Evaluation Metric Choice},
  author={Jerzak, Connor T. and Ritwik Vashistha and Adel Daoud},
  journal={ArXiv Preprint},
  year={2024},
  volume={},
  pages={},
  publisher={}
}–
@article{murugaboopathy2026platonic,
  title={Platonic Representations for Poverty Mapping: Unified Vision-Language Codes or Agent-Induced Novelty?},
  author={Murugaboopathy, Satiyabooshan and Connor T. Jerzak and Adel Daoud},
  journal={Proceedings of the 7th International Conference on Social Computing (ICSC 2026), of Communications in Computer and Information Science},
  year={2026},
  volume={},
  pages={},
  publisher={Springer Nature}
}[Video]
–
@article{jerzak2023image,
  title={Image-based Treatment Effect Heterogeneity},
  author={Jerzak, Connor T. and Fredrik Johansson and Adel Daoud},
  journal={Proceedings of the Second Conference on Causal Learning and Reasoning (CLeaR), Proceedings of Machine Learning Research (PMLR)},
  year={2023},
  volume={213},
  pages={531-552},
  publisher={}
}–
@article{sakamoto2026scoping,
  title={A Scoping Review of Earth Observation and Machine Learning for Causal Inference: Implications for the Geography of Poverty},
  author={Sakamoto, Kazuki and Connor T. Jerzak and Adel Daoud},
  journal={Hall, Ola and Ibrahim Wahab (eds.), Geography of Poverty},
  year={2026},
  volume={},
  pages={},
  publisher={Edward Elgar Publishing (Cheltenham, UK)}
}–
@article{jerzak2023integrating,
  title={Integrating Earth Observation Data into Causal Inference: Challenges and Opportunities},
  author={Jerzak, Connor T. and Fredrik Johansson and Adel Daoud},
  journal={ArXiv Preprint},
  year={2023},
  volume={},
  pages={},
  publisher={}
}–
@article{jerzak2023causalimages,
  title={CausalImages: An R Package for Causal Inference with Earth Observation, Bio-medical, and Social Science Images},
  author={Jerzak, Connor T. and Adel Daoud},
  journal={ArXiv Preprint},
  year={2023},
  volume={},
  pages={},
  publisher={}
}–
Planetary Causal Inference Bulletin
Scaling Laws for Multi-scale Dynamics
Policymakers and researchers analyzing randomized controlled trials (RCTs) increasingly harness satellite imagery to capture the geographical, socioeconomic, or environmental covariates believed to moderate an intervention’s impact. Some of those moderating factors might be locally confined—such as…Continue reading
New Directions in Planetary Causal Inference
Planetary causal inference (PCI) is a field where we draw on experimental, observational, or natural experimental data from social, natural, and environmental sciences and link those sources to satellite imagery or other Earth Observation (EO) data….Continue reading
Earth Observation Meets Adam Smith
Satellite imagery is contributing to how we measure and understand global poverty. From miles above Earth, high-resolution photographs capture details of villages, farms, and cities that conventional surveys might have a hard time capturing. By analyzing these…Continue reading
Introducing the PCI RCT Repo
Randomized controlled trials (RCTs) long ago proved themselves as workhorses of rigorous social science, medical research, and policy evaluation. Yet, they can struggle to account for the spatial and contextual heterogeneity of real-world settings: there are so many factors….Continue reading
–


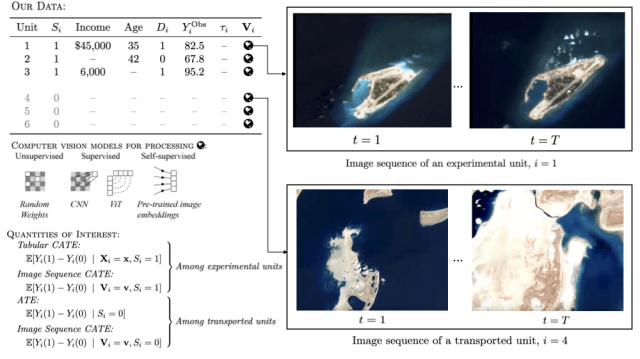


What is Planetary Causal Inference (PCI)?
Answer: Planetary causal inference (PCI) combines causal inference with Earth Observation (EO) data—especially satellite imagery—to study cause-and-effect across space and time. It’s designed for settings where the “context” (infrastructure, land use, climate, neighborhood change) matters, but high-quality ground data can be sparse or inconsistent.
TL;DR: PCI = causal inference + satellite/planetary-scale data for stronger measurement, clearer mechanisms, and better generalization.
- Key idea: Use EO data as a consistent, global source of covariates and outcomes—then layer causal designs on top.
- What it enables: Treatment effect heterogeneity, transportability/generalizability, and confounder modeling at scale.
- Common terms: “EO-based causal inference,” “remote sensing causal inference,” “satellite imagery + causal inference,” and “geospatial causal inference.”
In classic notation, many studies focus on the average treatment effect: \text{ATE}=\mathbb{E}[Y(1)-Y(0)]. PCI keeps that goal, but expands what we can condition on (and sometimes what we can measure) using imagery and other planetary-scale signals.
How is PCI different from “standard” causal inference (and from remote sensing prediction)?
Answer: Standard causal inference often relies on tabular covariates collected during a study; PCI adds high-dimensional, spatially-aligned EO data that can capture historical and geographic context. Unlike remote sensing used purely for prediction or mapping, PCI uses experimental, quasi-experimental, or observational identification strategies to estimate counterfactual effects.
TL;DR: PCI isn’t “maps that predict”—it’s causal designs + EO data to answer “what caused what?” and “where does it work best?”
| Approach | Primary goal | Typical inputs | Typical risks |
|---|---|---|---|
| Standard causal inference | Estimate ATE/CATE with structured covariates | Surveys, admin data, experiments | Missing/biased covariates; limited coverage |
| Remote sensing prediction | Forecast/map outcomes | Satellite imagery, labels, ML models | Correlation masquerading as causation |
| Planetary causal inference | Estimate causal effects + mechanisms across space | Causal designs + EO features/outcomes | Leakage, spatial dependence, domain shift |
When should you use satellite imagery in a causal study (and when shouldn’t you)?
Answer: Use EO imagery when the unit of analysis is geolocated and important confounders or mechanisms are “written on the landscape” (roads, roofs, crops, urban form, environmental shocks). It’s especially helpful for studying treatment effect heterogeneity and for extending inference to places where survey covariates were never collected or are outdated.
TL;DR: EO helps most when it adds pre-treatment context you can’t reliably get any other way.
Best for:
- Heterogeneity questions: “Where does this intervention work best?” “Which contexts are high responders?”
- Transportability/generalizability: predicting effects in new regions using consistent EO covariates.
- Confounder modeling: proxying hard-to-measure context in observational studies (with careful assumptions and diagnostics).
- Mechanisms: linking causal effects to changes in infrastructure, land use, or environmental conditions.
Risky without safeguards:
- Post-treatment imagery: using images taken after treatment rollout can silently bake outcomes into your “covariates.”
- Purely correlational pipelines: high accuracy maps are not causal estimates unless paired with a valid design.
- Weak overlap: if treated and control locations are fundamentally different, imagery won’t fix identification by itself.
What does a typical PCI workflow look like?
Answer: A PCI workflow starts with a causal question and a design (RCT, natural experiment, or observational identification strategy). Then you align units and time windows to imagery, convert images into features (e.g., embeddings), and estimate effects/heterogeneity with uncertainty. Finally, you validate robustness and interpret mechanisms with maps, segments, or cross-site replication.
TL;DR: Design first, imagery second, estimation third, interpretation last.
- Define the causal estimand: ATE, CATE, mediation/mechanisms, spillovers, or transportability.
- Lock the design: randomization, DiD, IV/RD, matching/weighting, or other identification strategy.
- Time-align EO inputs: decide (and document) pre-treatment image windows; keep post-treatment images separate.
- Build representations: hand-crafted features or learned embeddings (single-scale or multi-scale crops).
- Estimate effects: choose estimators appropriate to the design; report uncertainty and sensitivity.
- Validate honestly: use spatial/temporal splits when relevant; check overlap and calibration.
- Interpret + communicate: maps, subgroup summaries, and mechanism-oriented visualizations.
What are the biggest pitfalls in PCI (and practical ways to reduce them)?
Answer: The hardest PCI mistakes are subtle: leakage (using post-treatment signals), spatial dependence (treating neighbors as independent), and overfitting high-dimensional features on small samples. The best defenses are careful time windows, spatially-aware validation, and sensitivity analyses—not just bigger models.
TL;DR: If it feels “too predictive,” double-check leakage, dependence, and overlap.
- Leakage (pre vs. post): Keep EO covariates strictly pre-treatment; treat post-treatment imagery as outcomes or mechanisms.
- Spatial autocorrelation: Use clustered standard errors, spatial blocks for validation splits, or explicit spatial models when needed.
- Scale mismatch: Household vs. neighborhood vs. region signals differ—multi-scale representations can capture both local and contextual drivers.
- Domain shift (sensor/time): Check robustness across seasons, sensors, and years; document preprocessing and normalization.
- Missingness (clouds, artifacts): Track coverage; avoid systematic exclusion that correlates with treatment/outcomes.
- Ethics + privacy: Prefer coarser resolutions when possible; protect sensitive coordinates and follow IRB/data governance norms.
Where should you start (papers, code, and data) if you’re new to PCI?
Answer: Start with overview pieces that define the field and its core methodological challenges, then move to concrete examples on heterogeneity and confounding. If you want to implement, begin with the software and tutorials—then work backward to the papers to understand assumptions and diagnostics.
TL;DR: Read one overview, one heterogeneity paper, one confounding paper—then open the code.
Orientation (big picture)
- PlanetaryCausalInference.org (field overview, posts, and resources)
- A Scoping Review of EO + ML for Causal Inference (Overview)
- Integrating Earth Observation Data into Causal Inference (Overview)
Treatment effect heterogeneity (CATE) with EO imagery
- Image-based Treatment Effect Heterogeneity (PDF)
- Optimizing Multi-Scale Representations for EO-based heterogeneity (Overview)
- Optimizing Multi-Scale Representations… (PMLR page)
- Effect Heterogeneity with EO in RCTs: data/model/metric choices (Overview)
Confounding + observational inference with EO
- Integrating EO Data into Causal Inference: Challenges and Opportunities (HTML)
- EO/ML/Causal Inference reading list (GitHub)
Tools you can actually run
FAQ: Planetary Causal Inference, EO imagery, and causal estimation
Answer: These answers are intentionally short so they’re easy to compare and cite. If you want a deeper dive, follow the “Start here” links above.
TL;DR: If you only remember one thing: EO data is powerful, but causal identification still comes from design + assumptions.
Is PCI the same as “remote sensing for prediction”?
No. Prediction focuses on mapping or forecasting outcomes, while PCI estimates counterfactual causal effects using a causal design (experimental, quasi-experimental, or carefully justified observational strategies).
Do you need an RCT to do planetary causal inference?
No. RCTs are a clean starting point for heterogeneity and transportability, but PCI also applies to natural experiments and observational inference—so long as you can defend identification and run robustness checks.
What is “treatment effect heterogeneity” in the PCI context?
It means the effect of an intervention varies by context—sometimes in ways that aren’t captured by survey covariates. EO imagery can encode local and neighborhood conditions that help explain where effects are larger, smaller, or even reversed.
What is “image confounding,” and why can EO help?
In many observational settings, treatment assignment depends on local context that’s hard to measure with surveys. EO imagery can act as a proxy for parts of that context, helping reduce confounding—though it never replaces the need to justify identification assumptions.
How can you evaluate heterogeneity models without ground-truth individual effects?
You can evaluate whether a model can reliably rank “high responders” better than random—using targeting-style metrics that don’t require knowing each unit’s true causal effect. Simulations (where the mechanism is known) are also a core tool for validation.
How do you avoid using post-treatment images by accident?
Decide your pre-treatment image windows before you look at results, and document them. Treat any imagery collected after treatment rollout as outcomes, mechanisms, or auxiliary evidence—not as covariates for identification.
Where can I find code and data to replicate or extend PCI work?
Start with the CausalImages package (software + tutorials) and the linked replication datasets/corpora when available. Then use the paper pages above to locate the exact repos, DOIs, and supplemental materials for each project.
–
Note: See this GitHub Repo for a list of related papers from the broader literature, compiled by team member Kaz Sakamoto.

–